Time Zone: GMT +3
Time Frame: Daily (D1) / Weekly Outlook
Weekly Fundamental Overview:
LTC/USD remains sensitive to broad macroeconomic sentiment and shifts in US Dollar dynamics driven by upcoming economic indicators. As crypto markets react to liquidity conditions and risk appetite, incoming US data on employment and business activity could shape market sentiment for LTCUSD.
Price Action:
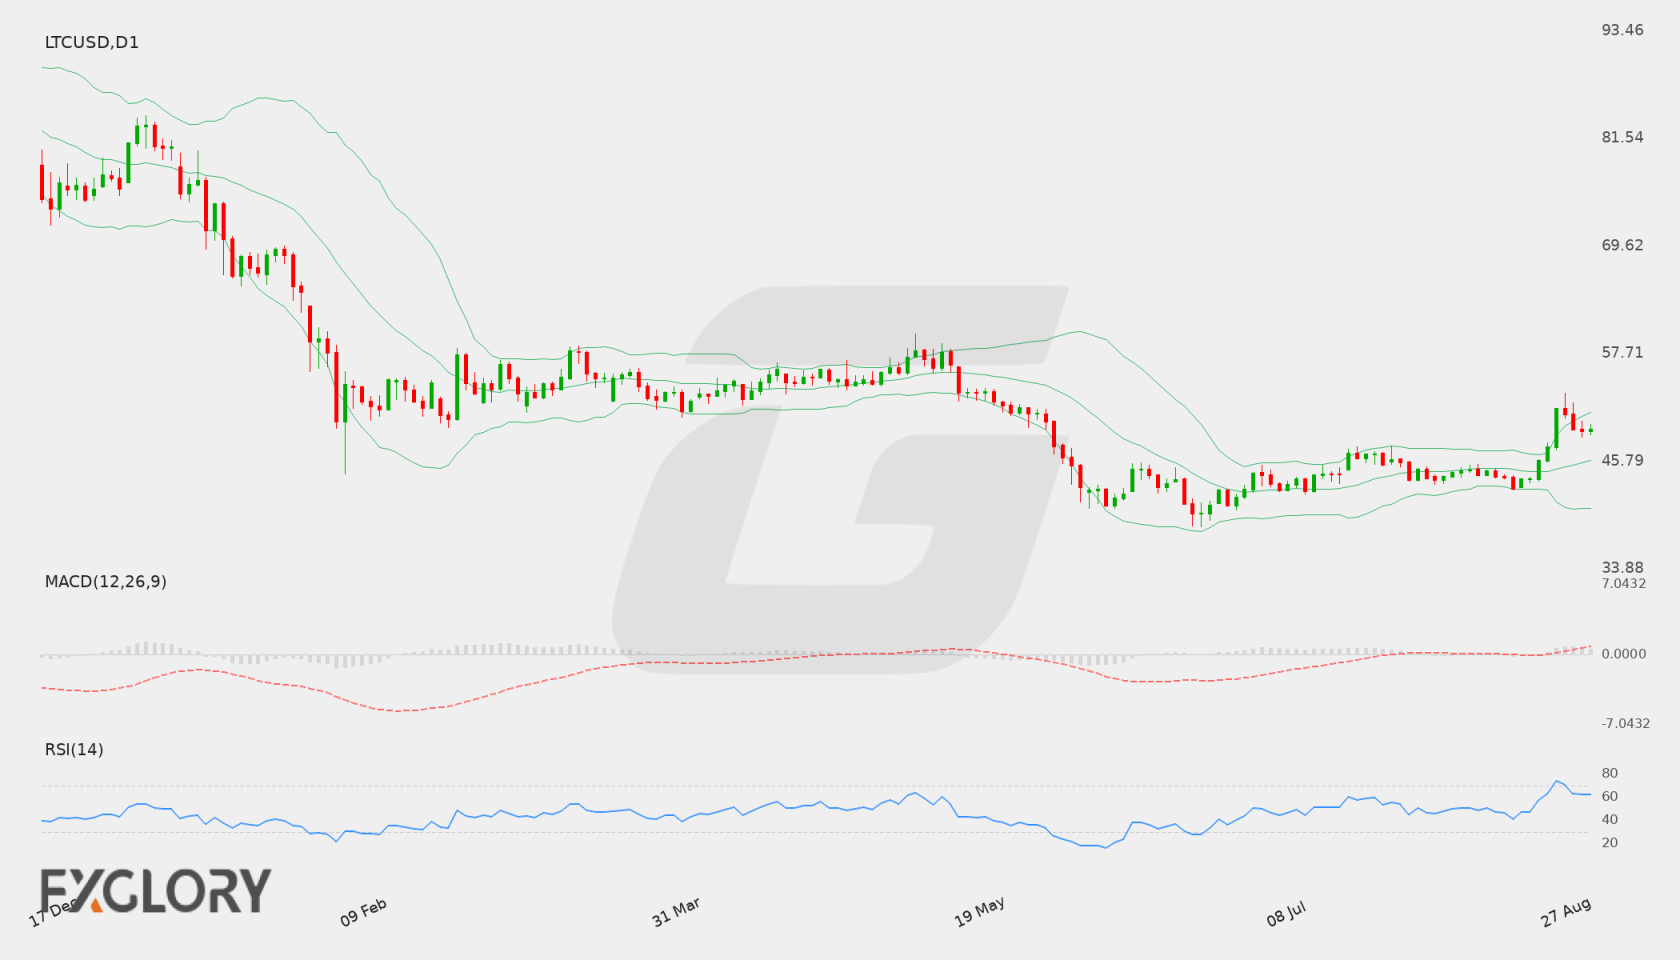
On the daily chart, LTC/USD (LTCUSD) recently surged from recent lower levels near 42.75 up to a peak near 53.32 before pulling back to settle at a last close of 49.27. The recent upward expansion demonstrates renewed buying interest, though the pullback from resistance highlights short-term consolidation.
Key Technical Indicators:
Bollinger Bands: The Bollinger Bands on the daily timeframe show a middle band at 45.83, an upper band at 51.14, and a lower band at 40.52. LTC/USD closed at 49.27, trading above the middle band and slightly below the upper band, indicating positive momentum following the recent upward push.
RSI: The 14-period Relative Strength Index (RSI) stands at 62.26. Operating above the 50 neutral threshold, the RSI indicates a favorable bullish bias without currently entering overbought territory.
MACD: The MACD indicator prints a positive value of 1.33 on the daily chart. This reflects bullish momentum, supporting the recent price rally in LTCUSD, although traders monitor for potential momentum shifts if price continues to consolidate near key levels.
Support and Resistance:
Key technical levels for LTC/USD include primary daily support at 38.49 and key daily resistance at 53.32. Intermediate technical reference points include the middle Bollinger Band at 45.83 and the upper band at 51.14.
News to Watch for LTCUSD This Week:
- ISM Manufacturing PMI: Reflects industrial health in the US, which can influence broad risk sentiment across digital assets like LTCUSD.
- JOLTS Job Openings: Highlights labor market tightness and potential shifts in USD strength.
- ISM Manufacturing Prices: Tracks inflationary pressures that may affect broader financial market liquidity.
- ADP Non-Farm Employment Change: Provides early insight into US private sector employment trends and USD volatility.
- ISM Services PMI: Measures activity in the services sector, impacting overall economic outlook and market sentiment.
- Non-Farm Employment Change: Directly impacts USD momentum and broader financial market risk appetite.
- Unemployment Rate: Offers key guidance on US labor conditions, influencing trader sentiment across crypto markets.
- Average Hourly Earnings m/m: Measures wage growth and inflation dynamics that can drive shifts in dollar valuation.
Weekly Outlook and Consideration:
LTC/USD (LTCUSD) enters the upcoming trading period with a constructively bullish tone following its recent rise to test resistance at 53.32 and closing at 49.27. With the RSI at 62.26 and MACD at 1.33, momentum indicators favor buyers as long as price remains above the middle Bollinger Band at 45.83. A sustained move above 51.14 could open the path toward testing resistance at 53.32 once again. Conversely, if seller pressure increases, initial downside buffer lies near the middle band, with primary support anchored at 38.49.
Disclaimer: The analysis provided for LTC/USD is for informational purposes only and does not constitute investment advice. Traders are encouraged to perform their own analysis and research before making any trading decisions. Market conditions can change quickly, so staying informed with the latest data is essential.