Time Zone: GMT +3
Time Frame: Daily (D1) / Weekly Outlook
Weekly Fundamental Overview:
The USD/SGD pair faces potential volatility as market participants digest incoming macroeconomic data alongside shifting broader risk sentiment. Key economic indicators, particularly from the United States, including inflation, labor market metrics, and GDP updates, may influence monetary policy expectations and impact price dynamics for USDSGD.
Price Action:
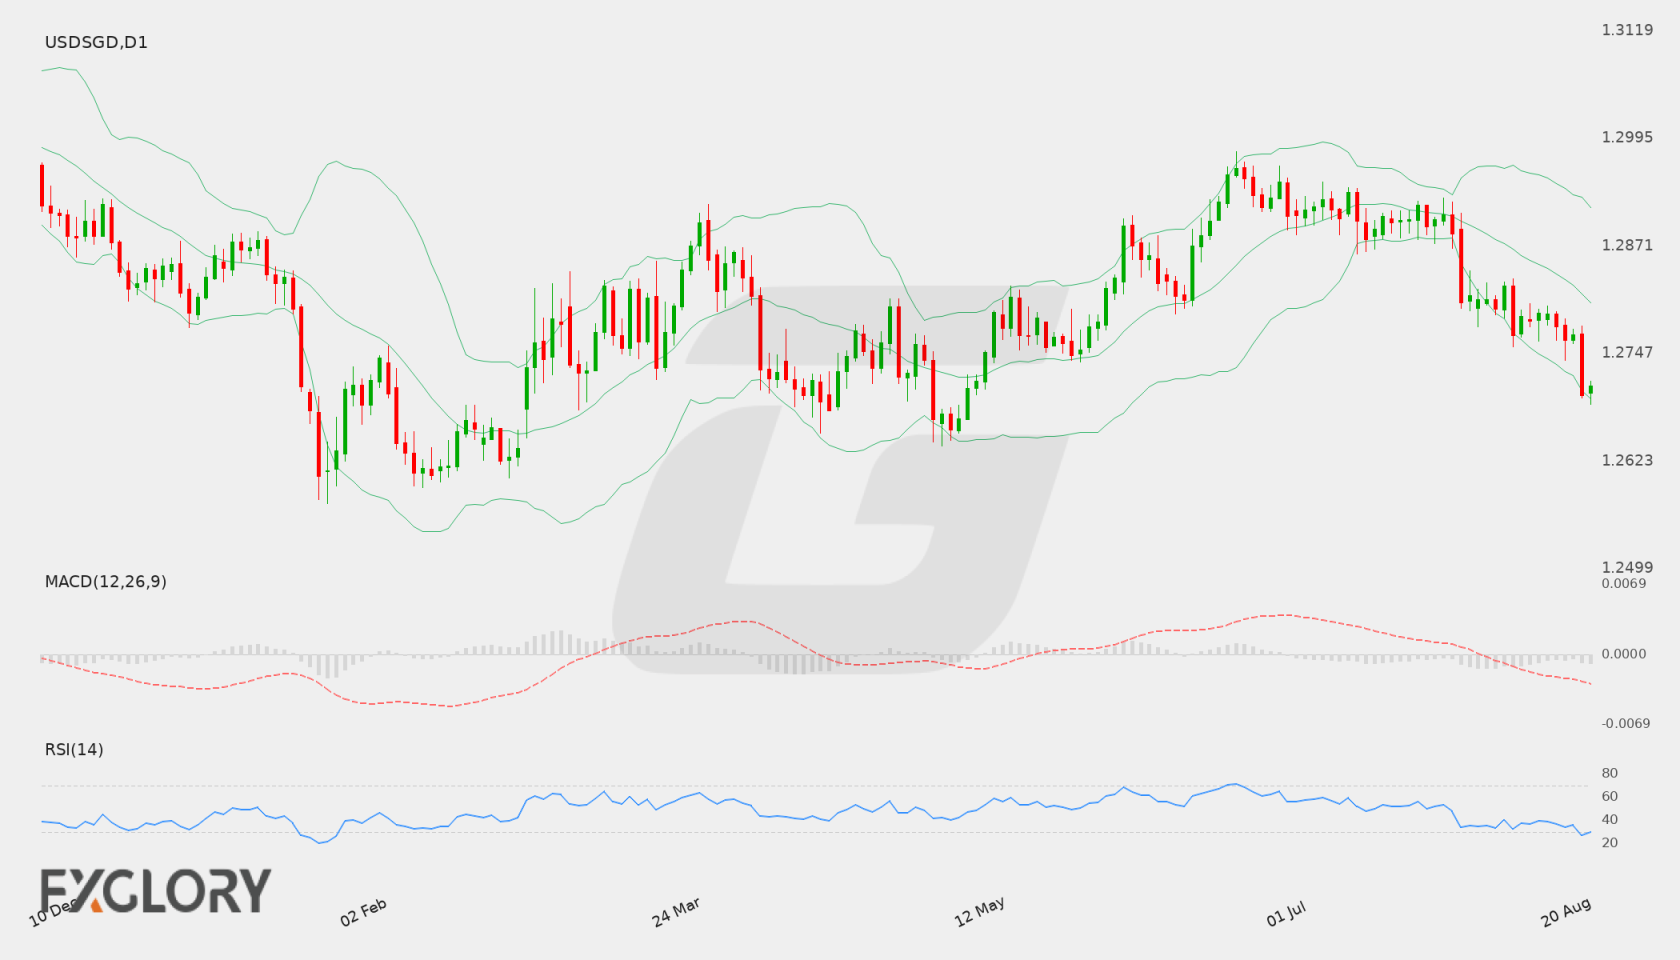
On the Daily (D1) chart, USD/SGD has shown a persistent downward trajectory, recently closing near 1.27098. Price action remains constrained near recent multi-session lows, with spot trading below its key daily averages as sellers test levels approaching support at 1.26885, while technical resistance stands at 1.29797.
Key Technical Indicators:
Bollinger Bands: Bollinger Bands on the daily timeframe reflect an expanding range, with the middle band positioned at 1.28050, the upper band at 1.29152, and the lower band at 1.26948. USD/SGD is currently trading close to the lower band, highlighting heavy downward momentum over recent sessions.
RSI: The 14-day Relative Strength Index (RSI) stands at 29.46, placing the indicator in oversold territory below 30. While this confirms strong downward momentum, it also suggests the potential for a temporary stabilization or corrective bounce.
MACD: The daily MACD indicator is situated in negative territory at -0.00383, reinforcing the prevailing downside momentum and indicating that bearish pressure currently dominates the medium-term picture for USD/SGD.
Support and Resistance:
Key daily technical levels for USD/SGD feature primary support at 1.26885 and main resistance at 1.29797. Intermediate dynamic resistance is marked by the middle Bollinger Band at 1.28050.
News to Watch for USDSGD This Week:
- CB Consumer Confidence: Assesses consumer sentiment regarding economic conditions, which can influence broad market confidence.
- Core PCE Price Index m/m: Measures core consumer inflation trends and could influence monetary policy expectations.
- Prelim GDP q/q: Reflects annualized economic growth rates and helps gauge overall economic health.
- Prelim GDP Price Index q/q: Measures price changes in goods and services and offers signals on underlying inflation trends.
- Unemployment Claims: Tracks weekly job market activity and offers timely insights into employment conditions.
- Prelim Benchmark Payrolls Revision: Re-evaluates historical job growth figures and can alter the medium-term labor market outlook.
Weekly Outlook and Consideration:
USD/SGD (USDSGD) enters the trading week positioned near lower levels following recent downside movement to a close of 1.27098. Technical indicators confirm bearish pressure with MACD at -0.00383, though an oversold RSI of 29.46 warns that downside momentum may face exhaustion near support at 1.26885. Should buyers defend this level, a retest of upper resistance levels toward 1.28050 and 1.29797 remains possible depending on high-impact economic releases.
Disclaimer: The analysis provided for USD/SGD is for informational purposes only and does not constitute investment advice. Traders are encouraged to perform their own analysis and research before making any trading decisions. Market conditions can change quickly, so staying informed with the latest data is essential.