Time Zone: GMT +3
Time Frame: Daily (D1) / Weekly Outlook
Weekly Fundamental Overview:
The USD/MXN currency pair continues to navigate fundamental drivers rooted in upcoming U.S. macroeconomic data releases. Markets are closely assessing upcoming inflation indicators, economic growth statistics, and labor data, which may influence demand for the U.S. Dollar relative to the Mexican Peso. Volatility for USDMXN could increase depending on how these macroeconomic metrics align with broader policy expectations.
Price Action:
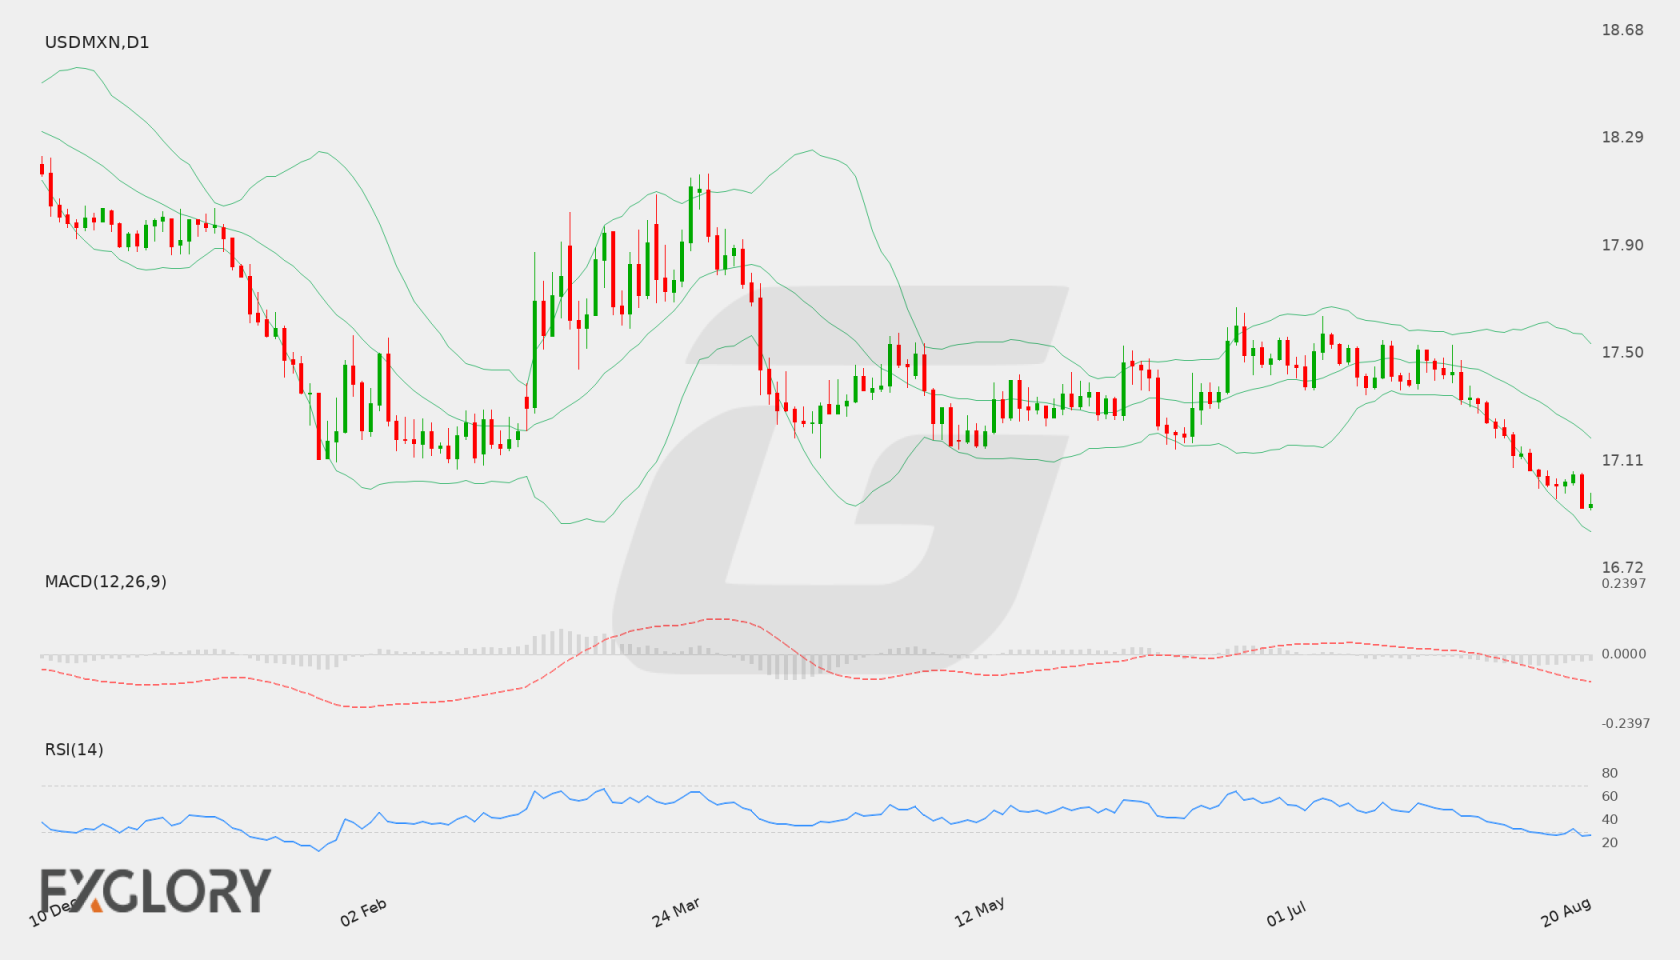
On the Daily (D1) chart, USD/MXN has demonstrated consistent downward price action, pressing from previous levels above 17.40 down toward a last close of 16.94942. Recent daily candles continue to trade near lower price boundaries, indicating sustained selling pressure over the recent sessions.
Key Technical Indicators:
Bollinger Bands: The 20-period Daily Bollinger Bands show the middle band at 17.19446, with the upper band at 17.53707 and the lower band at 16.85184. USD/MXN is trading near the lower Bollinger Band at 16.94942, underscoring ongoing downward technical pressure.
RSI: The 14-day Relative Strength Index (RSI) stands at 27.17, placing USD/MXN in oversold territory below the 30 threshold. While this confirms strong downward momentum, it also suggests the potential for short-term consolidation or price stabilization.
MACD: The MACD indicator on the D1 chart registers at -0.11607, holding below the zero line. This negative reading indicates ongoing bearish momentum for USDMXN in the current daily setup.
Support and Resistance:
Key Daily technical levels for USD/MXN place immediate support at 16.92928 and primary resistance at 17.66976. The pair remains bounded by these technical markers.
News to Watch for USDMXN This Week:
- CB Consumer Confidence: Assesses consumer sentiment which may influence U.S. economic growth expectations.
- Core PCE Price Index m/m: Tracks inflation trends that can impact monetary policy expectations.
- Prelim GDP q/q: Measures quarterly economic output to gauge national growth momentum.
- Prelim GDP Price Index q/q: Reflects broader price changes across gross domestic product.
- Unemployment Claims: Tracks weekly jobless claims to measure ongoing labor market strength.
- Prelim Benchmark Payrolls Revision: Re-evaluates historical job growth data to update official employment trends.
Weekly Outlook and Consideration:
The weekly outlook for USD/MXN indicates a prevailing bearish structure on the D1 time frame, as the pair trades near 16.94942. With support at 16.92928 and the lower Bollinger Band at 16.85184 nearby, traders will monitor whether support holds or gives way. An oversold RSI of 27.17 and a negative MACD of -0.11607 highlight potential for heightened volatility, with resistance located up at 17.66976 if a corrective rebound occurs.
Disclaimer: The analysis provided for USD/MXN is for informational purposes only and does not constitute investment advice. Traders are encouraged to perform their own analysis and research before making any trading decisions. Market conditions can change quickly, so staying informed with the latest data is essential.