Time Zone: GMT +3
Time Frame: Daily (D1) / Weekly Outlook
Weekly Fundamental Overview:
EURGBP trading reflects balanced economic conditions between the Eurozone and the United Kingdom, with trader focus turning toward upcoming Eurozone inflation metrics. Interest rate expectations and macroeconomic data continue to guide broader sentiment across the pair.
Price Action:
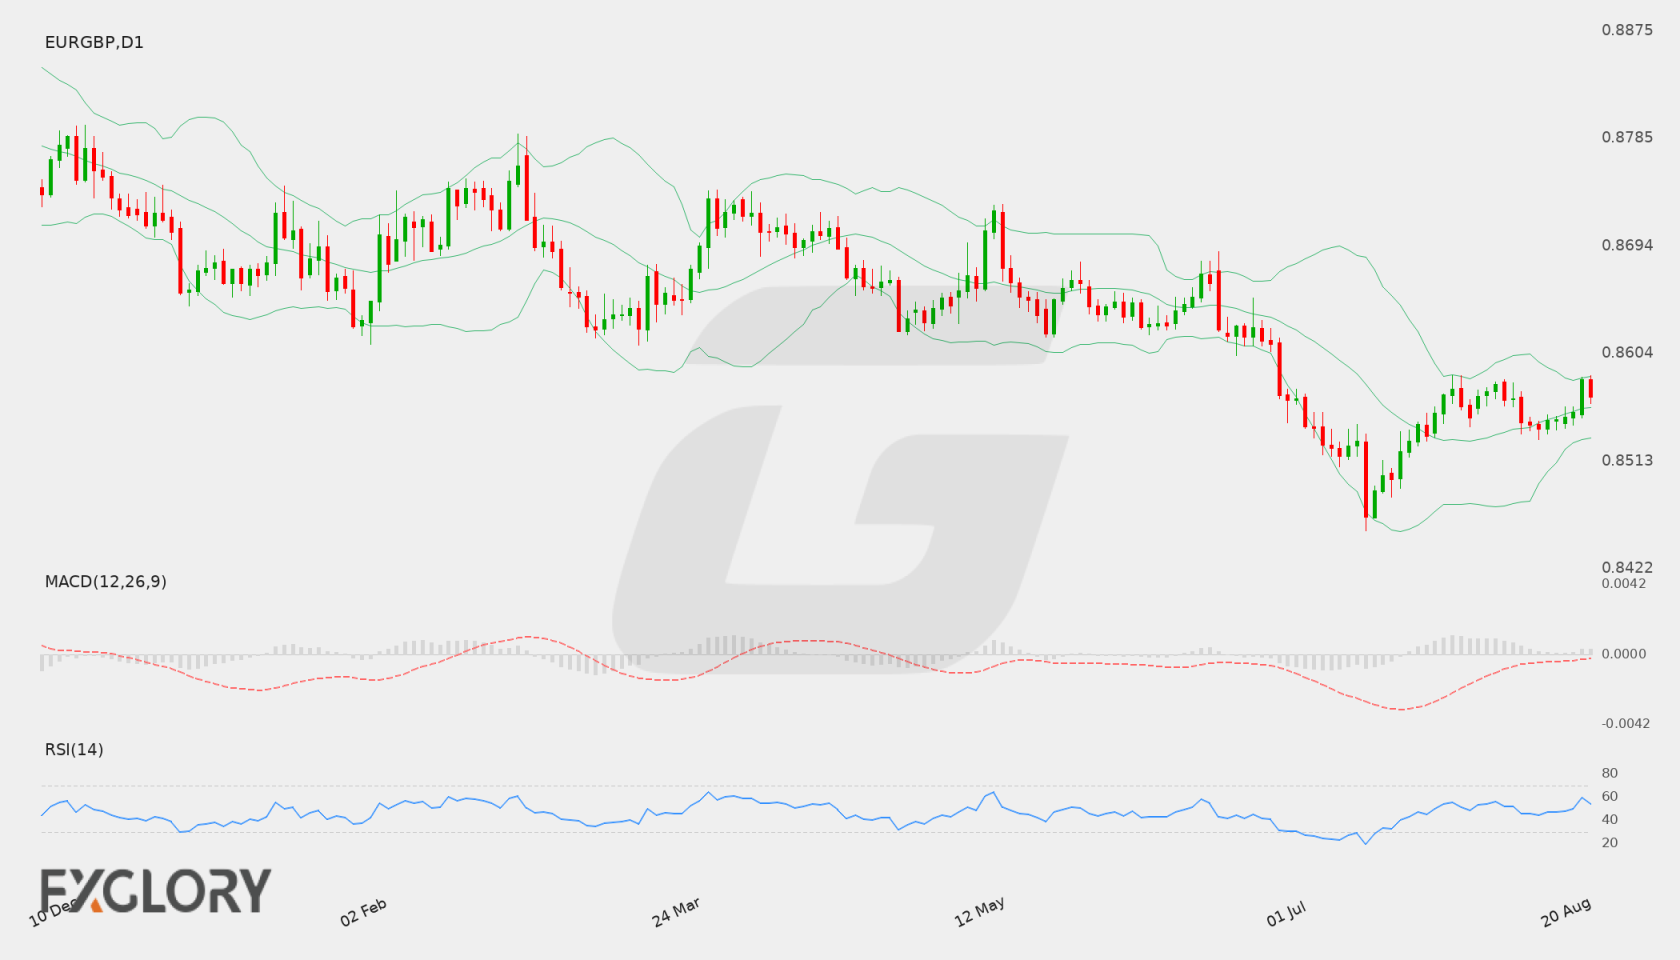
On the daily chart, EURGBP settled at 0.85671 after a slight pull back from the recent high of 0.85813. Price action remains in a consolidated posture above recent lows, holding slightly above the middle band of its recent daily range.
Key Technical Indicators:
Bollinger Bands: The daily Bollinger Bands place the middle boundary at 0.85581, the upper band at 0.85840, and the lower band at 0.85323. With the price close to 0.85671, EURGBP is oscillating near the upper half of the channel, indicating modest bullish stability.
RSI: The 14-day Relative Strength Index (RSI) stands at 53.55. Positioned near the neutral 50 level, the indicator reflects a balanced market environment without immediate overbought or oversold pressure.
MACD: The MACD indicator registers a slight positive reading of approximately 0.000063 near the zero line. This suggests momentum has stabilized following recent upward movement, reflecting a neutral-to-slightly bullish bias.
Support and Resistance:
Key chart levels indicate primary resistance situated at 0.86891, while major support rests lower at 0.8454.
News to Watch for EURGBP This Week:
- German Prelim CPI m/m: Measures monthly consumer price changes in Germany which can influence overall Eurozone inflation trends.
- CPI Flash Estimate y/y: Tracks headline annual inflation across the Eurozone to offer key insights into regional price pressures.
- Core CPI Flash Estimate y/y: Assesses underlying Eurozone inflation dynamics by excluding volatile food and energy costs.
Weekly Outlook and Consideration:
EURGBP maintains a mild upside bias on the daily chart as it closes near 0.85671, holding above the daily middle Bollinger Band of 0.85581. Technical metrics remain overall neutral, with an RSI of 53.55 and a positive MACD baseline. A continued breakout past the upper Bollinger Band near 0.85840 could open the path toward key resistance at 0.86891. Conversely, a drop below the middle band may send price testing lower support at 0.85323, with critical broader support identified at 0.8454.
Disclaimer: The analysis provided for EUR/GBP is for informational purposes only and does not constitute investment advice. Traders are encouraged to perform their own analysis and research before making any trading decisions. Market conditions can change quickly, so staying informed with the latest data is essential.