Time Zone: GMT +3
Time Frame: Daily (D1) / Weekly Outlook
Weekly Fundamental Overview:
Silver (SILVER) market dynamics remain sensitive to underlying macroeconomic developments, broader risk sentiment, and inflation expectations. Traders are monitoring upcoming economic releases closely, as shifts in consumer confidence, economic growth figures, and employment indicators can significantly sway market demand for precious metals and influence volatility across trading sessions.
Price Action:
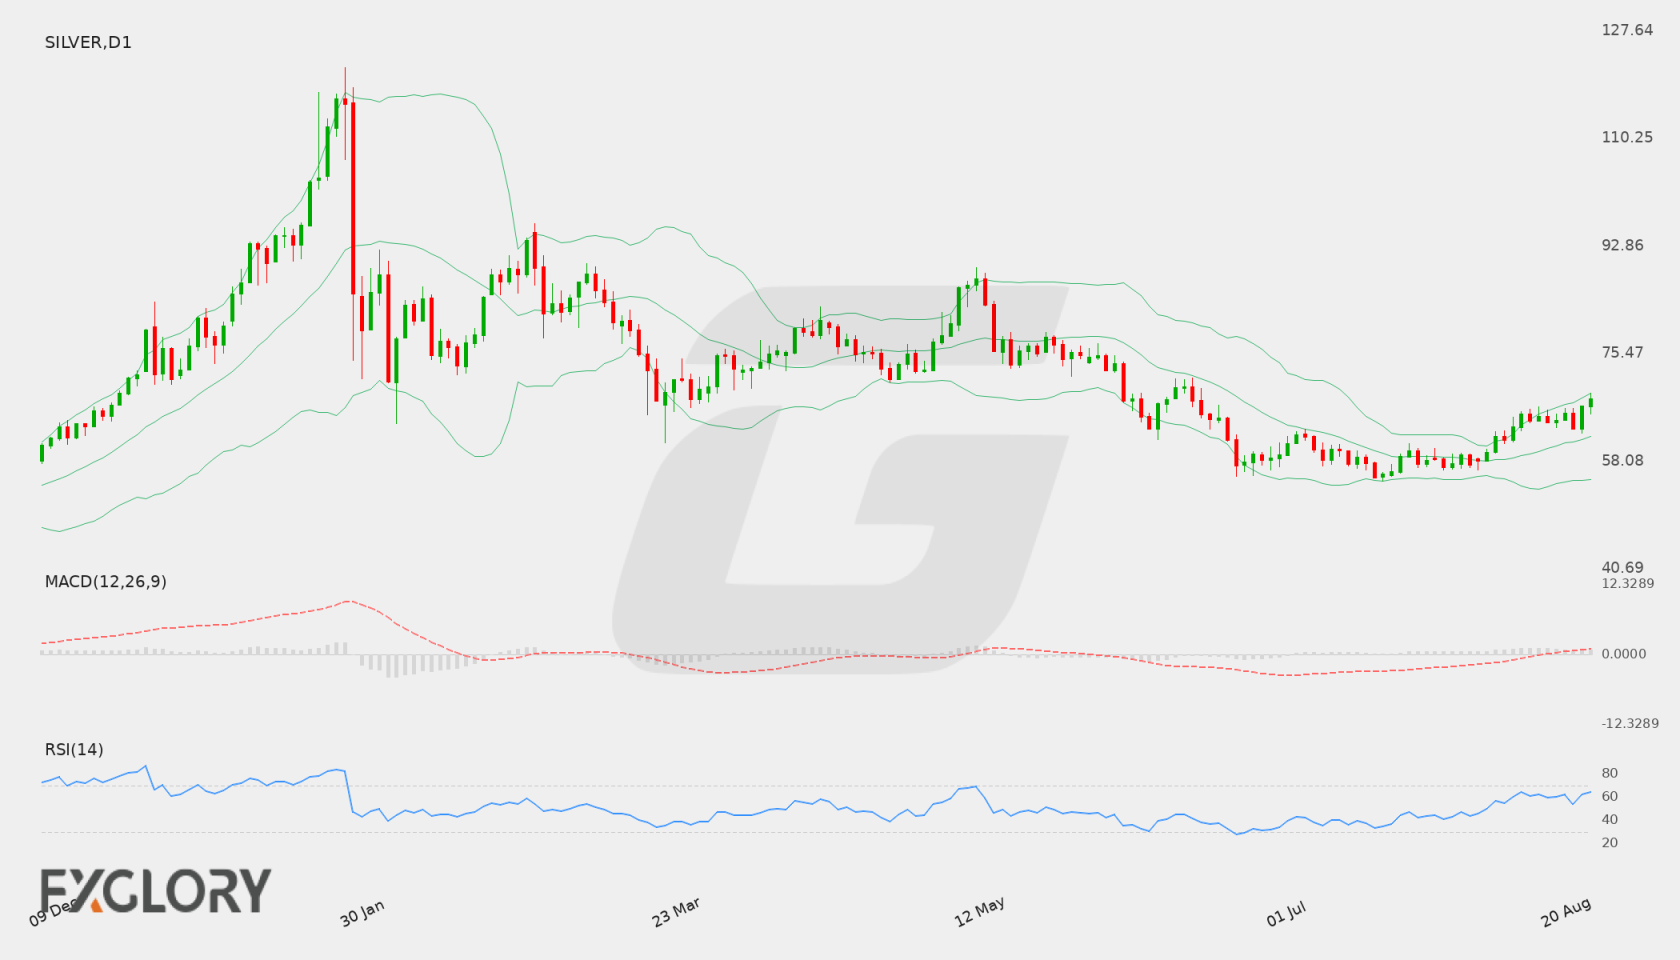
On the Daily (D1) timeframe, Silver (SILVER) has demonstrated renewed bullish strength, climbing from a recent daily low around 63.324 to record a last close of 68.079. The progression of higher closes indicates steady purchasing pressure, bringing price action closer to the upper boundary of its current daily trading range.
Key Technical Indicators:
Bollinger Bands: The Bollinger Bands indicator on the daily chart places the middle band at 62.081, the lower band at 55.073, and the upper band at 69.089. With the last close at 68.079, Silver (SILVER) is trading close to the upper band, pointing to strong upward momentum and potential volatility expansion if buying continues.
RSI: The 14-period Relative Strength Index (RSI) stands at 64.21. This signals that Silver (SILVER) is operating in bullish territory while remaining below the overbought threshold of 70, suggesting space for price development.
MACD: The MACD indicator for Silver (SILVER) registers a positive value of 1.6358. This reading above the zero line confirms sustained bullish momentum on the D1 chart, reflecting positive sentiment in recent sessions.
Support and Resistance:
Daily chart levels highlight primary support at 54.757 and primary resistance at 76.988. In addition, the middle Bollinger Band at 62.081 provides an intermediate dynamic reference level for price action.
News to Watch for SILVER This Week:
- CB Consumer Confidence: Reflects consumer sentiment trends that can influence risk appetite and demand for safe-haven asset classes.
- Core PCE Price Index m/m: Measures core consumer price changes to provide critical signals regarding inflation and monetary policy outlooks.
- Prelim GDP q/q: Evaluates annualized economic performance and overall growth conditions that shape broader market sentiment.
- Prelim GDP Price Index q/q: Tracks price changes in economic output to offer additional perspective on underlying inflationary pressures.
- Unemployment Claims: Serves as a frequent gauge of labor market health that can drive short-term volatility across financial markets.
- Prelim Benchmark Payrolls Revision: Updates historical employment figures to provide a clearer view of underlying labor market direction.
Weekly Outlook and Consideration:
Silver (SILVER) starts the week with positive technical positioning on the Daily (D1) chart, trading at 68.079 near the upper Bollinger Band of 69.089. Backed by a positive MACD of 1.6358 and an RSI of 64.21, buyers may attempt to extend gains toward resistance at 76.988. However, incoming high-impact economic data could trigger volatility, with any pullbacks finding potential technical backing around the middle band at 62.081 or major support at 54.757.
Disclaimer: The analysis provided for Silver is for informational purposes only and does not constitute investment advice. Traders are encouraged to perform their own analysis and research before making any trading decisions. Market conditions can change quickly, so staying informed with the latest data is essential.