Time Zone: GMT +3
Time Frame: 4 Hours (H4)
Fundamental Analysis:
Silver (XAGUSD) is currently influenced by key US economic events, including ADP Non-Farm Employment Change, Retail Sales, and PMI/ISM reports, which are critical indicators of economic strength and consumer spending. Stronger-than-expected US data typically supports the US Dollar, placing downward pressure on Silver due to their inverse relationship. Additionally, speeches from Federal Reserve officials such as Alberto Musalem and Michael Barr may introduce volatility, as hawkish tones could reinforce expectations of tighter monetary policy. Overall, today’s fundamental landscape suggests heightened volatility with a slight bearish bias unless data disappoints.
Price Action:
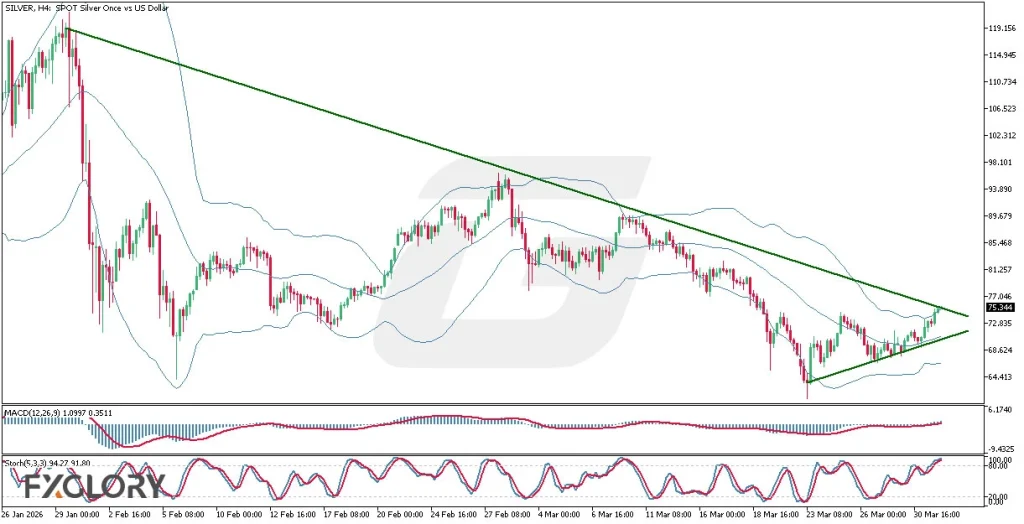
The H4 chart of Silver shows a clear bearish trend with a sequence of lower highs, reinforced by a descending trendline. However, recent price action indicates a bullish recovery attempt, with candles forming a tightening structure resembling a symmetrical triangle near support. Price is currently testing the trendline resistance, suggesting increasing buying pressure. A breakout above this level could shift momentum to the upside, while rejection would maintain the broader bearish outlook.
Key Technical Indicators:
Bollinger Bands (35): The Bollinger Bands have narrowed significantly, indicating low volatility and a likely upcoming breakout. Price is approaching the upper band, reflecting increasing bullish pressure.
MACD (12,26,9): The MACD shows a bullish crossover with the histogram turning positive, suggesting growing upward momentum. However, the strength of the move remains moderate and not yet fully confirmed.
Stochastic (5,3,3): The Stochastic oscillator is in the overbought zone, indicating a potential short-term pullback. Still, the strong upward slope signals that bullish momentum remains active.
Support and Resistance:
Support: Immediate support is located near the 64.40–65.00 area, aligning with the recent swing low and consolidation base.
Resistance: Key resistance is positioned around 75.30–76.00, coinciding with the descending trendline and recent highs.
Conclusion and Consideration:
Silver on the H4 timeframe shows signs of a potential bullish breakout despite the prevailing downtrend. Technical indicators suggest increasing buying momentum, supported by price compression near resistance. However, overbought conditions and upcoming US economic data could trigger volatility, so confirmation of a breakout is essential before considering further upside.
Disclaimer: The analysis provided for XAG/USD is for informational purposes only and does not constitute investment advice. Traders are encouraged to perform their own analysis and research before making any trading decisions on XAGUSD. Market conditions can change quickly, so staying informed with the latest data is essential.