Time Zone: GMT +3
Time Frame: 4 Hours H4
Fundamental Analysis:
The XAUUSD pair, also known as Gold Spot versus the US Dollar, remains highly sensitive to USD news today as traders monitor ADP employment data, S&P Global Services PMI, ISM Services PMI, Factory Orders, the Fed Beige Book, EIA crude inventories, and speeches from Fed officials including Goolsbee, Barr, and Logan. Stronger than expected US labor or services data could support the US Dollar and Treasury yields, which may pressure Gold price action, while weaker data or dovish Federal Reserve commentary could increase demand for Gold as a safe haven asset. This makes today’s XAUUSD H4 technical and fundamental analysis especially important, as Gold daily chart sentiment may shift quickly depending on inflation expectations, interest rate outlook, and broader market risk appetite.
Price Action:
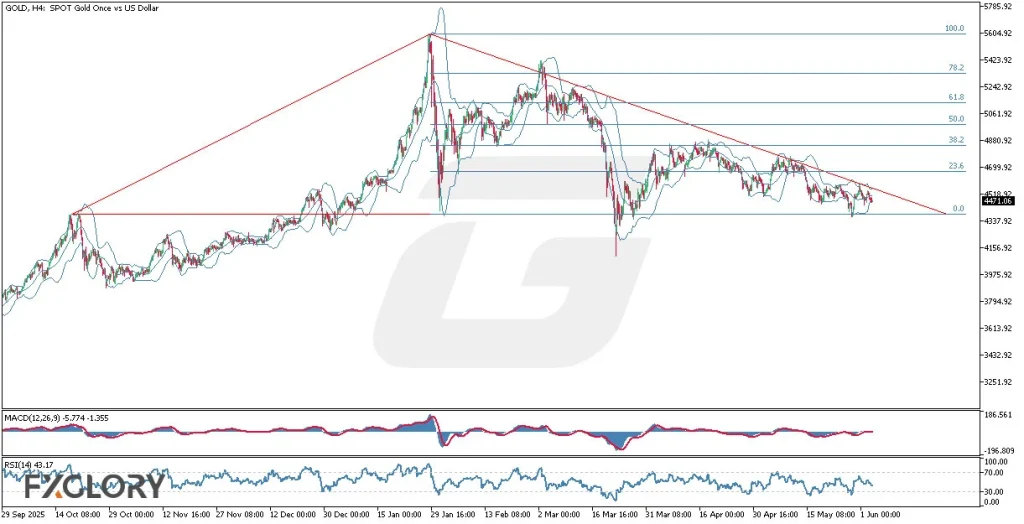
The Gold H4 chart shows a bearish to sideways correction, with price making lower highs beneath the red descending trendline after a strong previous rally. Current XAU/USD price action is holding near the 4471 support area, but the market remains capped below the main resistance zone around 4700, showing that sellers still control the short term structure. The broader Gold H4 forecast suggests consolidation unless buyers break above the descending triangle resistance, while a failure to hold 4471 and 4380 could extend bearish momentum toward lower support zones.
Key Technical Indicators:
Bollinger Bands(20,2.000): The Bollinger Bands on the Gold H4 chart are tightening, showing reduced volatility and a possible buildup before the next breakout. Price is trading near the lower side of the bands, which reflects weak bullish momentum and continued downside pressure. For XAU-USD technical analysis, this setup suggests that Gold may remain in consolidation unless price breaks clearly above the middle band and descending trendline.
MACD(12,26,9): The MACD is flat and slightly bearish, with values around -5.774 and -1.355, confirming weak momentum on the XAU/USD H4 chart. The lack of strong histogram expansion suggests that sellers are present but not yet driving a major impulsive move. Traders should watch for a bearish widening below the signal line or a bullish crossover to confirm the next Gold market direction.
RSI(14): The RSI is around 43, which indicates weak momentum but not yet oversold conditions. This means Gold still has room to move lower before reaching extreme downside exhaustion. In XAUUSD H4 price action analysis, RSI below the 50 level supports the bearish to neutral outlook unless buyers regain momentum above the midline.
Support and Resistance:
Support: The immediate support area is near 4471, followed by stronger downside support around 4380 and 4338 if selling pressure continues.
Resistance: The nearest resistance is around 4700, followed by 4880 and 5060, while a stronger bullish breakout could expose 5240, 5420, and 5605.
Conclusion and Consideration:
The XAU-USD H4 technical analysis shows Gold trading in a bearish to sideways correction, with price compressed under a descending red trendline and struggling to regain bullish momentum. Bollinger Bands, MACD, RSI, and Fibonacci levels all suggest caution, as Gold price action remains weak while holding near support. Fundamentally, today’s USD news, Fed speeches, ADP employment data, Services PMI, ISM PMI, Factory Orders, and Beige Book could create sharp volatility in GOLD versus the US Dollar. A breakout above 4700 may shift the Gold H4 outlook toward recovery, while a breakdown below 4471 and 4380 could strengthen the bearish daily chart forecast.
Disclaimer: The analysis provided for GOLD/USD is for informational purposes only and does not constitute investment advice. Traders are encouraged to perform their own analysis and research before making any trading decisions on GOLDUSD. Market conditions can change quickly, so staying informed with the latest data is essential.