Time Zone: GMT +3
Time Frame: 4 Hours (H4)
Fundamental Analysis:
The BTC/USD pair may face elevated volatility today as several USD-related events are scheduled, including speeches from multiple Federal Reserve officials and key US economic releases such as Goods Trade Balance, Wholesale Inventories, and Chicago PMI. For this Bitcoin vs US Dollar H4 technical and fundamental chart daily analysis, any hawkish Federal Reserve tone could support the US Dollar and pressure BTCUSD price action, while softer language may help Bitcoin stabilize. Traders should monitor FOMC commentary closely, as interest-rate expectations remain a major driver of crypto market sentiment and BTC/USD volatility.
Price Action:
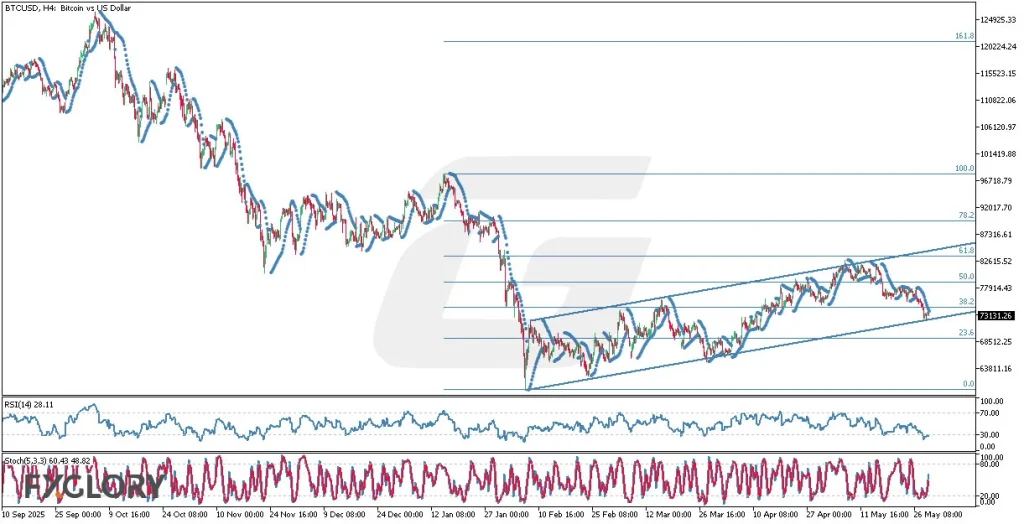
BTCUSD on the H4 chart remains in a broader bearish structure despite the recovery rally from the February low, and price is now weakening near the lower boundary of the rising corrective channel. The BTC USD price action shows lower highs and bearish rejection from the mid-to-upper channel area, suggesting sellers are regaining control. Unless Bitcoin reclaims the 77.9k–78k zone, the H4 chart forecast favors continued downside pressure toward the next support areas.
Key Technical Indicators:
Parabolic SAR: The Parabolic SAR dots have flipped above price, confirming short-term bearish momentum on the BTCUSD H4 chart. This supports the view that sellers currently control the immediate trend. A reversal signal would require price to break back above the SAR structure.
RSI: The RSI(14) is near 28, showing strong bearish pressure and approaching oversold territory. This indicates weak buying momentum in the Bitcoin technical analysis outlook. However, oversold readings may also trigger a short-term corrective bounce if support holds.
Stochastic Oscillator: The Stochastic indicator is deep in the lower zone, reflecting exhausted downside momentum. The weak crossing behavior does not yet confirm a bullish reversal. BTCUSD traders should wait for a stronger upward crossover before assuming recovery momentum.
Support and Resistance:
Support: Immediate support is located around 73.1k, aligned with the 38.2% Fibonacci retracement and the lower channel zone. Stronger support is near 68.5k at the 23.6% Fibonacci level.
Resistance: Initial resistance is around 77.9k–78k, matching the 50.0% Fibonacci retracement. Major resistance stands near 82.6k, where the 61.8% Fibonacci level and previous rejection area converge.
Conclusion and Consideration:
The BTCUSD H4 technical analysis suggests bearish momentum is increasing as price pressures the lower side of the rising corrective channel. RSI and Stochastic show oversold conditions, so a short-term bounce is possible, but the overall Bitcoin price action remains vulnerable unless BTC/USD recovers above 77.9k–78k. Fundamental analysis for BTCUSD today should focus on Federal Reserve speeches and US data, as stronger USD sentiment may accelerate downside pressure toward 73.1k and 68.5k.
Disclaimer: The analysis provided for BTC/USD is for informational purposes only and does not constitute investment advice. Traders are encouraged to perform their own analysis and research before making any trading decisions on BTCUSD. Market conditions can change quickly, so staying informed with the latest data is essential.