Time Zone: GMT +3
Time Frame: 4 Hours (H4)
Fundamental Analysis:
Today’s NZD/USD performance is expected to be influenced by both US and New Zealand economic data. On the US side, several key reports, such as Retail Sales and Factory Output, are scheduled. Strong retail sales data could reinforce expectations of higher US interest rates, boosting the USD. Conversely, weak sales data might support a dovish outlook for the Federal Reserve. The Federal Reserve Bank of Dallas President is also scheduled to speak, and any hawkish remarks might further strengthen the USD. On the New Zealand side, the Global Dairy Trade (GDT) auction report is due, a critical factor since dairy products play a significant role in New Zealand’s export economy. Positive data from the GDT auction could lend some support to the NZD.
Price Action:
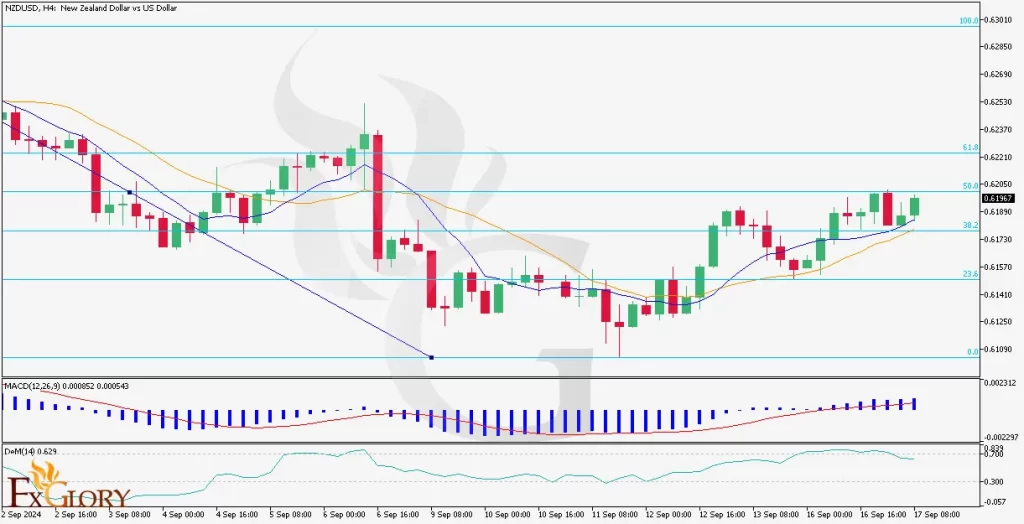
In the H4 time frame, the NZD USD pair shows signs of a recovery after a previous downtrend. The price action has been bullish in recent sessions, with 7 out of the last 10 candles closing higher. The recent retracement is bouncing off the 38.2% Fibonacci level and approaching the 50.0% level. This indicates that the pair is regaining strength after a short pullback, signaling potential bullish continuation.
Key Technical Indicators:
MA Short (9): The short-term 9-period moving average has crossed above the 17-period long moving average, suggesting that upward momentum is building.
MA Long (17): The 17-period moving average is now acting as dynamic support, confirming that bullish momentum is gaining strength. The crossover is a classic sign of trend reversal, which aligns with the recent bullish price action.
MACD (12,26,9): The MACD line is currently above the signal line, indicating a bullish trend in place. However, the histogram shows slight divergence, suggesting that momentum may slow down in the short term. Traders should monitor closely for any potential bearish crossover, which could signal a trend reversal.
DeMarker (14): The DeMarker indicator currently stands at 0.52, indicating that the market is in a neutral zone with no overbought or oversold conditions. This leaves room for further upward movement before approaching overbought levels, which could support the ongoing bullish trend.
Support and Resistance Levels:
Support: Immediate support is at 0.6155, aligning with the 38.2% Fibonacci level, followed by 0.6100 as a key psychological level.
Resistance: The first resistance is at 0.6200 near the 50.0% Fibonacci level, with the next level at 0.6230 at the 61.8% Fibonacci retracement.
Conclusion and Consideration:
The NZD/USD pair is exhibiting bullish momentum on the H4 chart, supported by positive price action and a moving average crossover. However, key fundamental events for both the USD and NZD are scheduled for today, which could introduce volatility. A breakout above the 50.0% Fibonacci level could trigger a continuation of the uptrend, while bearish data from the US might cap gains or lead to a reversal. It is crucial to monitor the upcoming Retail Sales data and GDT auction results, as these will provide further direction for the pair.
Disclaimer: The NZDUSD analysis provided is for informational purposes only and does not constitute investment advice. Market conditions can change rapidly, and traders should conduct their own research and stay updated with the latest developments before making trading decisions.