Current weekly forecast: This outlook covers 18–24 October 2026 and remains valid until 24 October 2026, unless its stated invalidation condition is triggered earlier.
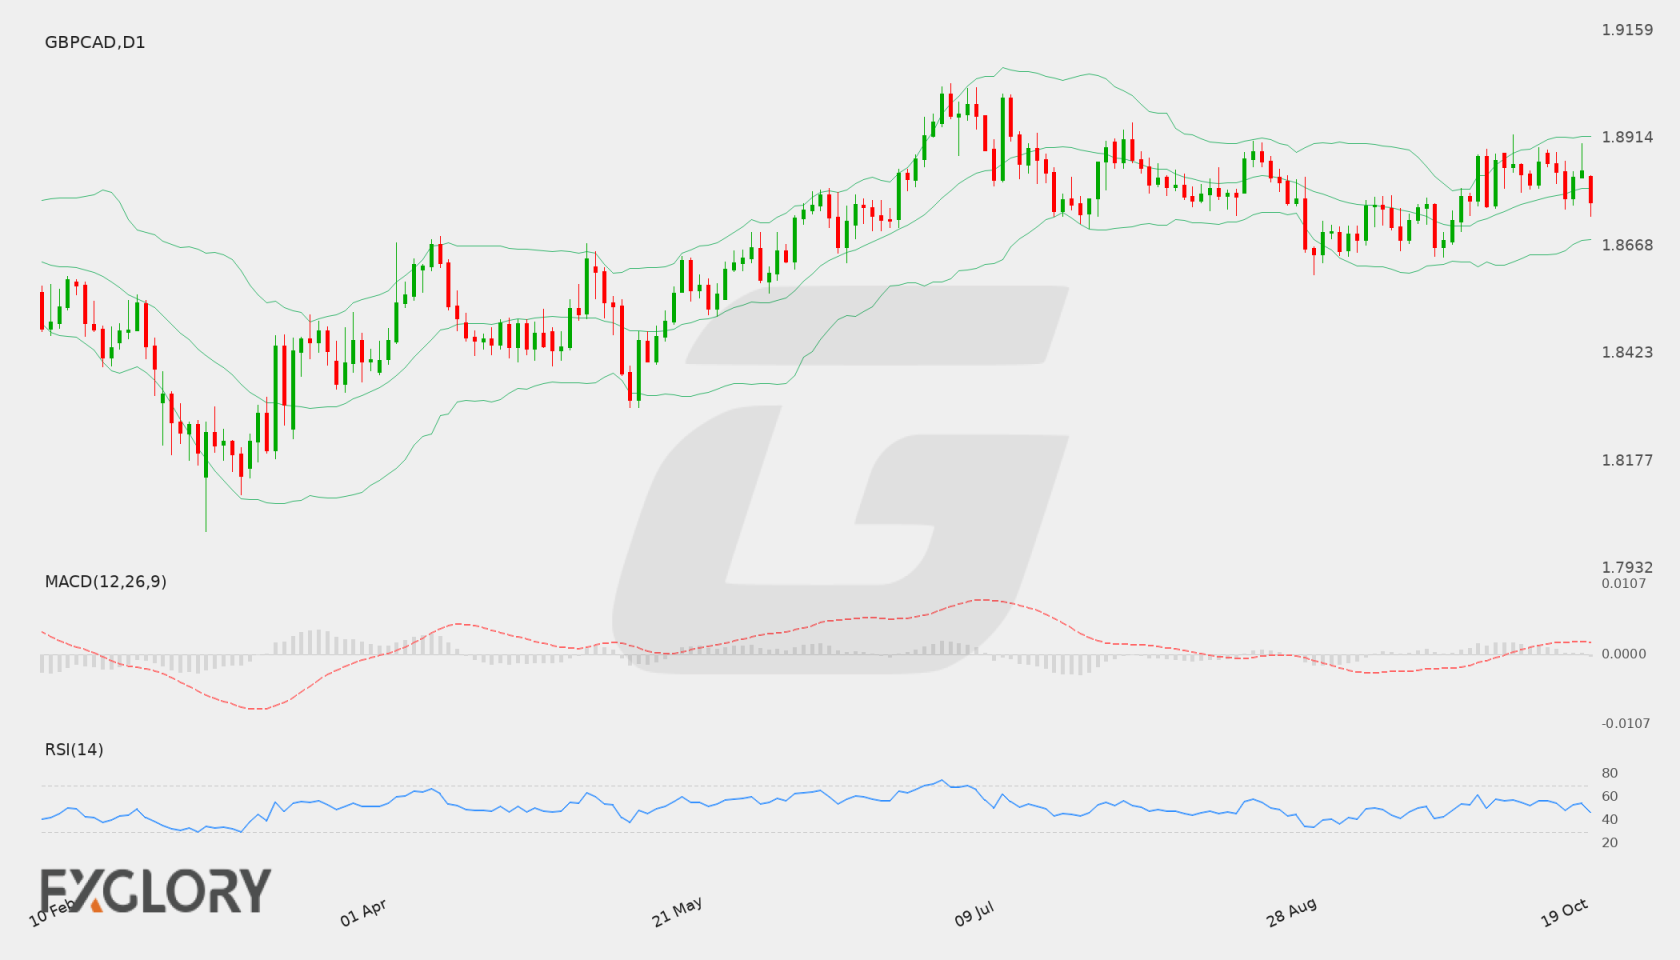
Daily check — 20 October 2026: The latest completed D1 close was 1.87676 on 19 October 2026. It remains above the lower formal invalidation level 1.86721; the upper calibrated boundary 1.89148 is an extension/confirmation boundary. The authored weekly thesis remains valid.
In brief
GBP/CAD has a conditional bullish weekly bias, supported by rising D1 trend measures and bullish H4 context but tempered by mixed daily closes and neutral momentum.
The D1 trend is bullish, and both the EMA50 and SMA200 slopes are rising. The reference close at 1.88255 is above the primary support at 1.87839 and below primary resistance at 1.88895, leaving those supplied levels as the nearest framework for assessing whether the trend can make further progress.
Momentum is neutral rather than strongly confirming: RSI is near its midpoint and the positive MACD histogram is small. H4 is bullish and its close is above its middle Bollinger band, which adds tactical support, but stable volatility and a mixed D1 close sequence argue against treating continuation as assured.
GBP/CAD D1 technical-analysis context for the weekly forecast. Chart data captured 20 October 2026.
GBP/CAD has a bullish weekly bias, supported by D1 structure and bullish H4 conditions, but mixed momentum and close sequencing leave consolidation risk.
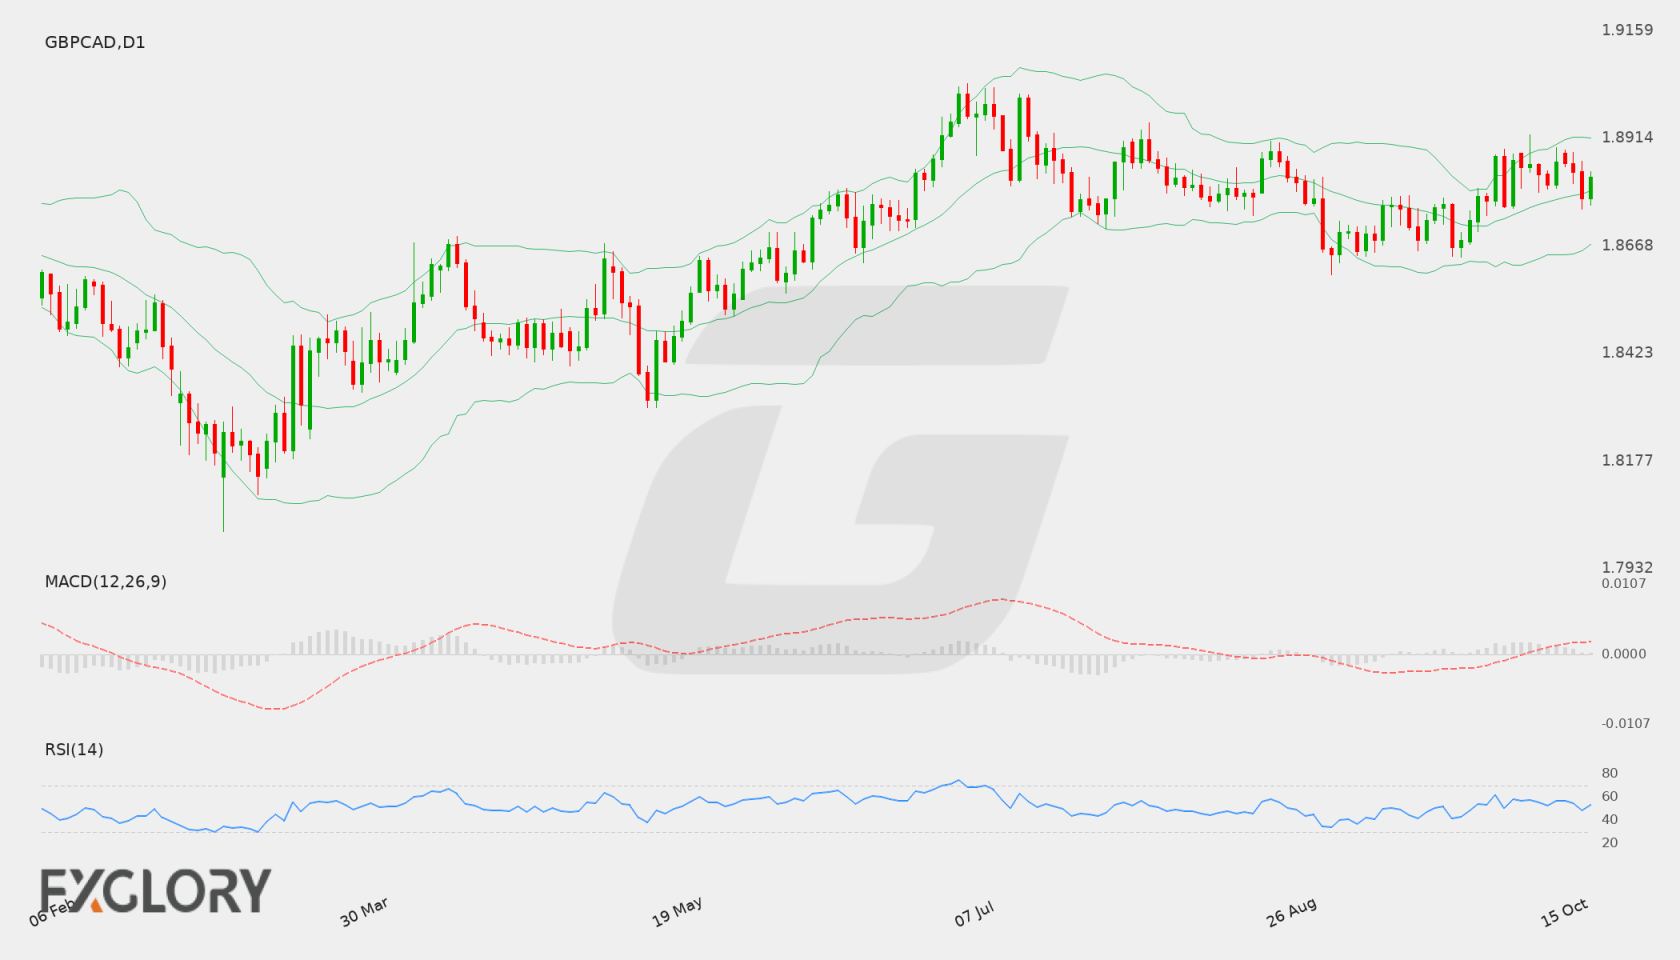
The weekly thesis is bullish because the D1 trend state is bullish and both the EMA50 slope and SMA200 slope are rising. The reference D1 close at 1.88087 is above the primary support at 1.87689 and below the primary resistance at 1.88895, leaving the market between important weekly boundaries.
Momentum is mixed rather than uniformly supportive, and the D1 close sequence is also mixed. H4 conditions are bullish, which keeps upside pressure relevant tactically, but the H4 picture does not replace the D1 structure. A move through the supplied resistance framework could bring 1.89489 and 1.90159 into focus, while deterioration toward 1.8708 and 1.86564 would expose countertrend pressure.
GBP/CAD D1 technical-analysis context for the weekly forecast. Chart data captured 16 October 2026.
GBP/CAD movement remains shaped by macroeconomic developments across the United Kingdom and Canada, alongside shifts in general market sentiment. With high-impact Canadian labor market releases approaching, the Canadian dollar could face renewed volatility depending on the health of domestic employment. Meanwhile, broader monetary policy considerations and global trade dynamics continue to guide the overarching direction for GBPCAD.
Price Action:
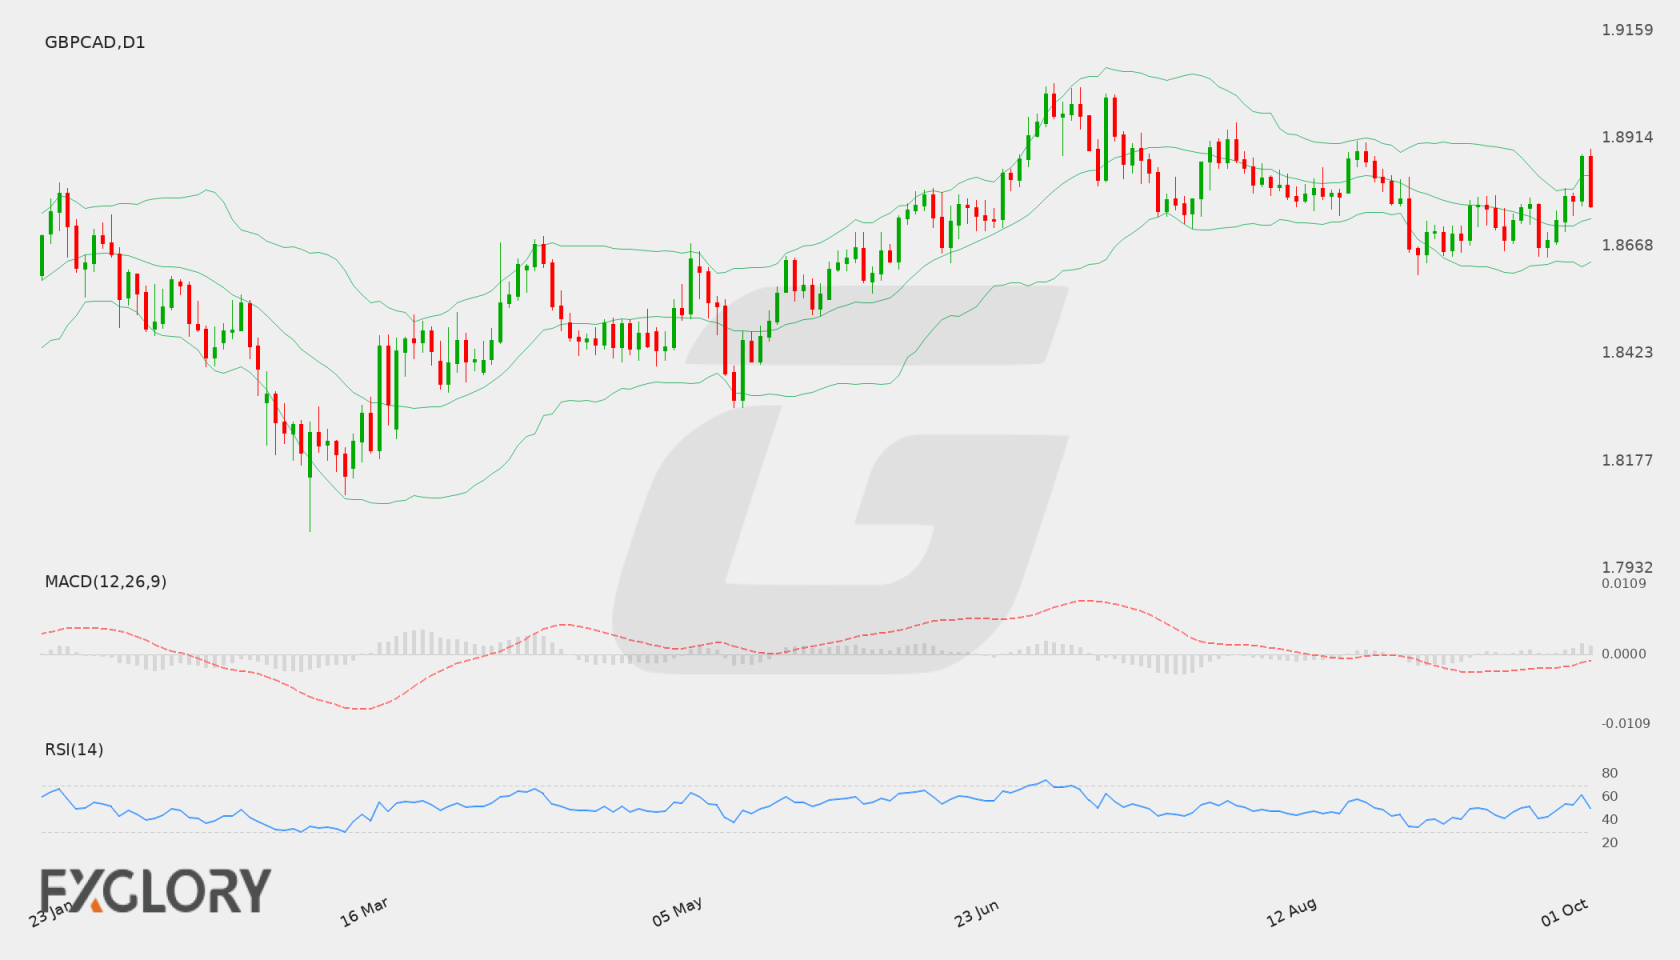
On the daily D1 chart, GBP/CAD closed at 1.87601 after retreating from an intraday high of 1.88895 and a previous daily close of 1.88724. Recent price activity shows the pair consolidating within a defined medium-term range, with pullbacks meeting demand above recent swing lows while upside tests near the upper boundary face moderate selling pressure.
Key Technical Indicators:
Bollinger Bands: The Bollinger Bands on the daily timeframe show a middle band baseline at 1.87302, with the upper band situated at 1.88295 and the lower band at 1.86310. With the latest close at 1.87601, GBP/CAD trades slightly above the midline, reflecting a balanced distribution within the band envelope and a lack of extreme directional stretch.
RSI: The 14-day Relative Strength Index (RSI) stands at 50.55. This reading positions the pair directly in neutral territory, confirming that GBP/CAD is neither overbought nor oversold on the daily scale, leaving room for price movement in either direction based on emerging catalysts.
MACD: The daily MACD currently registers at 0.00032, holding marginally above the baseline. This subdued positive value reflects a neutral momentum environment for GBPCAD, showing neither strong bullish acceleration nor decisive bearish divergence.
Support and Resistance:
Key technical levels for GBP/CAD identify primary daily support at 1.86027 and major resistance at 1.90299. Intermediate reference points include the Bollinger lower band at 1.86310 and upper band at 1.88295, framing the immediate trading channel for the pair.
News to Watch for GBPCAD This Week:
Ivey PMI: Assesses Canadian purchasing activity and provides insight into underlying economic momentum.
Unemployment Rate: Reflects Canadian labor market health and influences domestic monetary policy expectations.
Employment Change: Measures net hiring across Canada and serves as a major driver for Canadian dollar valuation.
Weekly Outlook and Consideration:
For the week ahead, GBP/CAD exhibits a balanced technical setup on the daily timeframe. With the RSI at 50.55, MACD near 0.00032, and the close at 1.87601 just above the 1.87302 middle Bollinger Band, the market appears consolidative. A sustained hold above the middle band could allow the pair to test upper resistance zones, with the upper Bollinger Band at 1.88295 and structural resistance at 1.90299 serving as key barriers. Conversely, a push below the middle band would bring the lower band at 1.86310 and primary support at 1.86027 into focus. Scheduled Canadian economic data, particularly the Ivey PMI and employment figures, will likely serve as primary catalysts dictating volatility and directional bias.
Disclaimer: The analysis provided for GBP/CAD is for informational purposes only and does not constitute investment advice. Traders are encouraged to perform their own analysis and research before making any trading decisions. Market conditions can change quickly, so staying informed with the latest data is essential.
Fundamental drivers for GBP/CAD remain tied to shifts in domestic economic performance and central bank expectations in both the UK and Canada. Market participants continue to evaluate economic growth metrics alongside energy market developments that influence CAD dynamics. Unpredictable macroeconomic data can create volatile conditions in the pair.
Price Action:
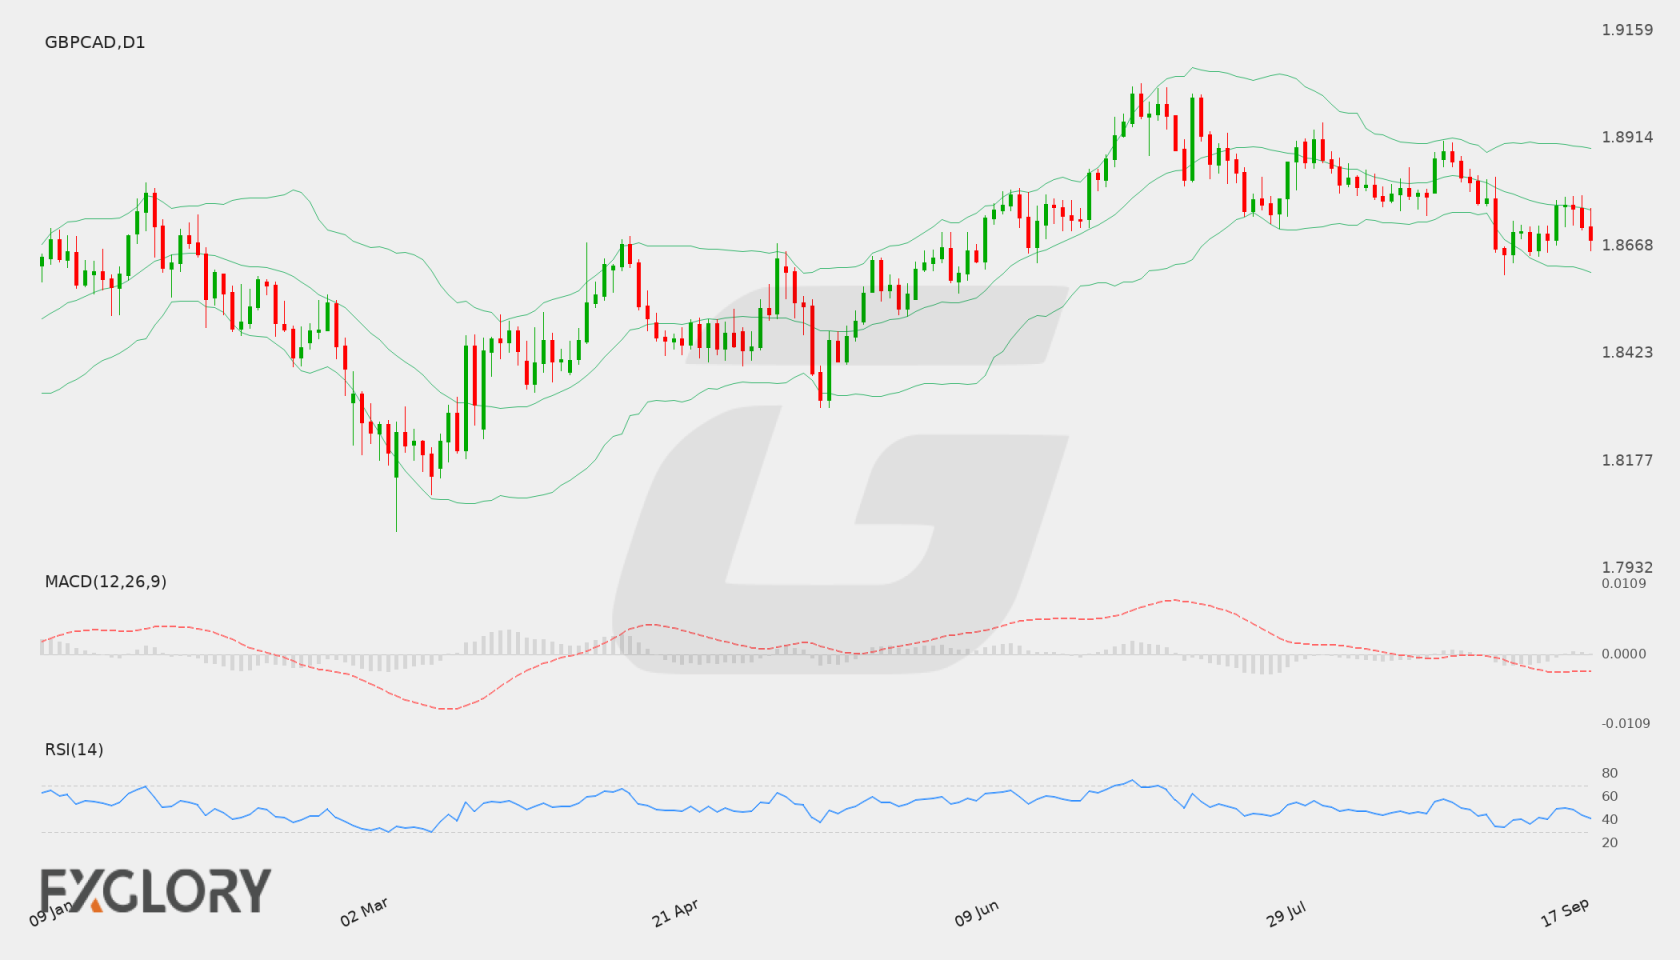
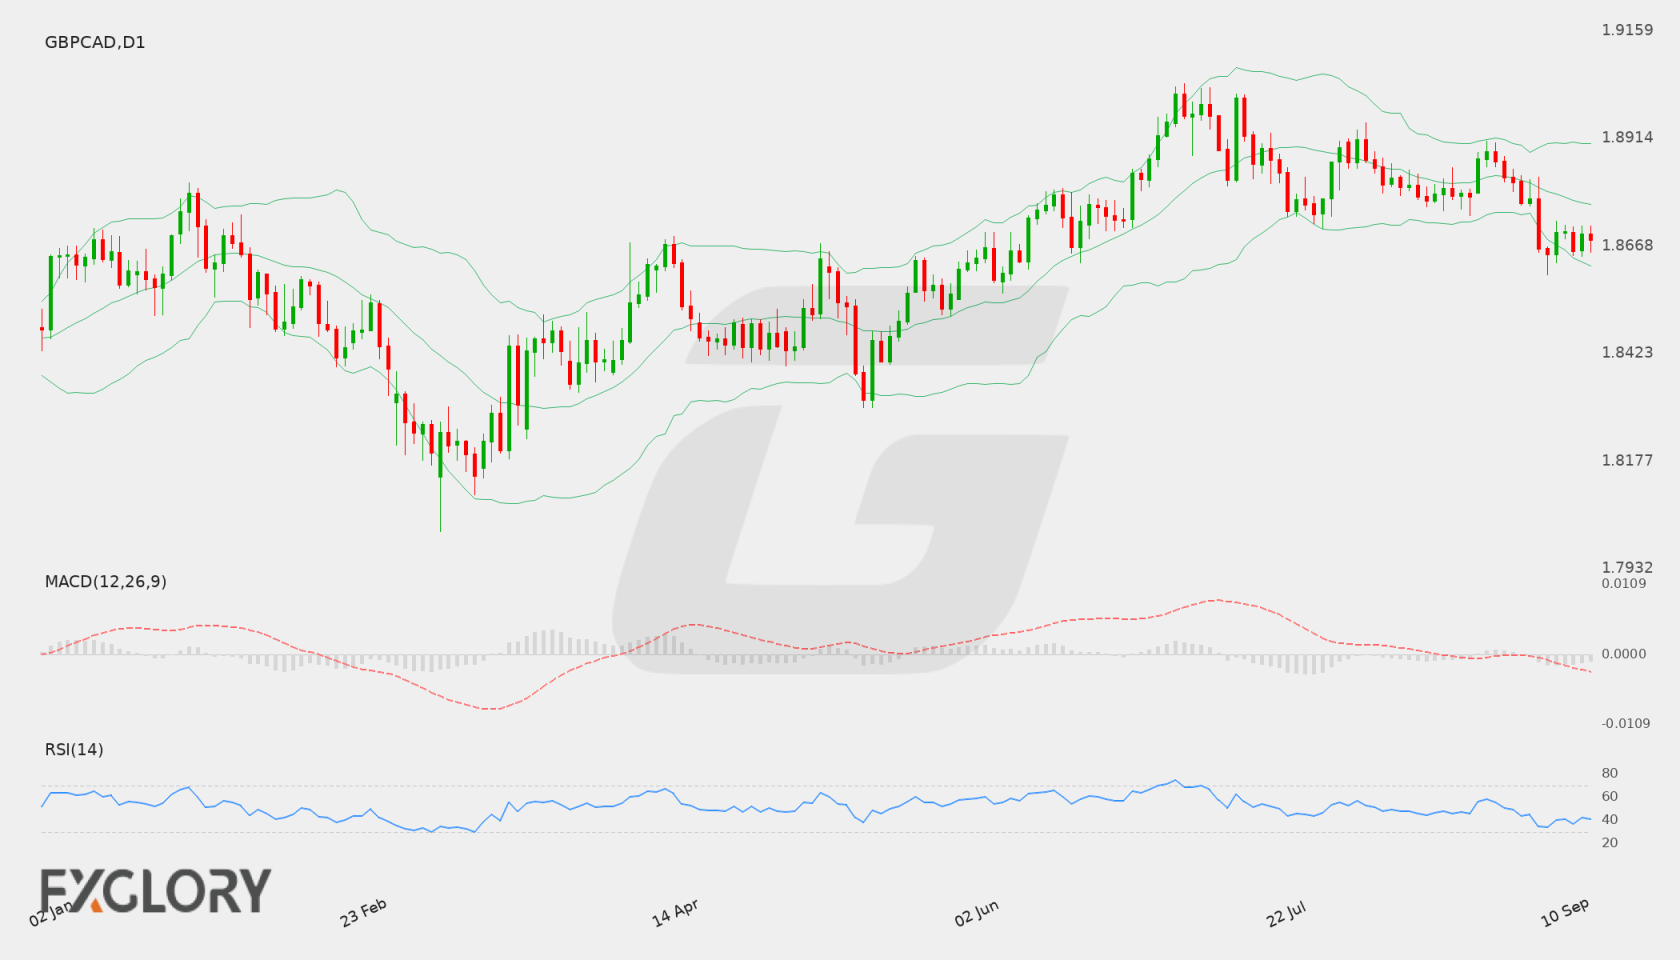
On the daily (D1) chart, GBP/CAD closed at 1.86824 after experiencing a downward drift from recent levels above 1.87500. Price action is pressing lower toward local support zones while remaining beneath the central moving average. A sustained movement beyond key boundaries will likely establish short-term directional bias.
Key Technical Indicators:
Bollinger Bands: The Bollinger Bands indicator shows a middle line at 1.87493, an upper band at 1.88909, and a lower band at 1.86077. With GBP/CAD trading near 1.86824, price is positioned in the lower portion of the band structure, reflecting recent downside momentum toward the lower boundary.
RSI: The 14-period Relative Strength Index (RSI) stands at 41.59. Holding below the 50 neutral threshold indicates modest bearish sentiment while staying clear of oversold conditions.
MACD: The MACD indicator currently sits at -0.00258, remaining below the zero line. This negative reading signals lingering downside momentum, indicating that sellers hold a temporary technical advantage on the daily timeframe.
Support and Resistance:
Key technical levels on the daily chart highlight resistance located at 1.90387, while primary support is established at 1.86027. A breakdown below support could open the door for further declines, whereas a bounce off this level may spark a recovery toward higher resistance zones.
News to Watch for GBPCAD This Week:
GDP m/m: This monthly output metric provides key insight into economic growth trends that can directly influence interest rate expectations and currency valuation.
Weekly Outlook and Consideration:
Looking ahead, GBP/CAD maintains a slightly bearish tilt on the daily chart as price hovers near 1.86824, positioned between middle band resistance at 1.87493 and lower support at 1.86027. With RSI at 41.59 and MACD in negative territory at -0.00258, traders should observe whether key support holds to allow a potential recovery or breaks to trigger further downside. Incoming economic releases like GDP m/m could serve as volatility catalysts.
Disclaimer: The analysis provided for GBP/CAD is for informational purposes only and does not constitute investment advice. Traders are encouraged to perform their own analysis and research before making any trading decisions. Market conditions can change quickly, so staying informed with the latest data is essential.
The GBP/CAD currency pair enters the week influenced by critical economic data from both the United Kingdom and Canada. Key market drivers include Canadian inflation data and pivotal UK economic releases alongside the Bank of England’s monetary policy decisions, which will provide fresh perspective on interest rate differentials and economic momentum.
Price Action:
On the daily chart, GBP/CAD recently settled around 1.86833 after experiencing downside pressure toward the lower region of its recent range. Price action reflects a slight bounce from recent lows near the 1.86027 support level, though broader upside momentum remains constrained below recent daily high zones.
Key Technical Indicators:
Bollinger Bands: The daily Bollinger Bands highlight a middle moving average at 1.87625, an upper band at 1.89022, and a lower band at 1.86227. With the latest close at 1.86833, GBP/CAD trades beneath the middle band and near the lower envelope, signaling recent bearish pressure across daily sessions.
RSI: The 14-day Relative Strength Index (RSI) stands at 40.71. Positioned below the neutral 50 level, the RSI reflects mild bearish sentiment while staying above the traditional oversold threshold of 30.
MACD: The daily MACD indicator registers a reading of -0.00383, holding below the zero line. This negative reading signals active bearish momentum in the pair, suggesting sellers maintain relative control on the daily timeframe.
Support and Resistance:
Crucial daily technical boundaries for GBP/CAD feature immediate support located around 1.86027, which has held recent downside tests. On the upside, key technical resistance is established at 1.90387, marking a potential barrier for any extended bullish recovery.
News to Watch for GBPCAD This Week:
Trimmed CPI y/y: This Canadian inflation metric provides key insight into underlying price pressures that could influence Bank of Canada policy.
Median CPI y/y: Updates on core Canadian inflation measure help clarify central bank interest rate expectations.
CPI m/m: Monthly Canadian consumer price index figures highlight short-term inflation trends affecting the Canadian dollar.
Common CPI y/y: Broader Canadian inflation tracking impacts rate path sentiment for the currency.
Claimant Count Change: UK labor market strength details can move expectations regarding British economic performance.
Average Earnings Index 3m/y: Wage growth data in the UK signals potential demand-pull inflationary pressures.
CPI y/y: UK headline annual inflation figures are critical for shaping interest rate expectations.
Official Bank Rate: The Bank of England interest rate decision directly impacts British pound yields and market valuation.
MPC Official Bank Rate Votes: Voting split among policymakers reveals internal consensus or division regarding monetary policy.
Monetary Policy Summary: Official statement outlines the economic assessment and future rate trajectory guidance.
Retail Sales m/m: UK consumer spending trends offer insights into domestic economic health and growth momentum.
Weekly Outlook and Consideration:
The weekly outlook for GBP/CAD points to a cautious trading environment as technical and fundamental forces align. With the D1 RSI at 40.71 and MACD at -0.00383, technical sentiment leans slightly negative while price trades below the 1.87625 Bollinger middle band. Traders will closely monitor whether the key support level at 1.86027 holds firm against downside pressure or if buyers can push back toward major resistance at 1.90387 amid incoming central bank announcements and economic data.
Disclaimer: The analysis provided for GBP/CAD is for informational purposes only and does not constitute investment advice. Traders are encouraged to perform their own analysis and research before making any trading decisions. Market conditions can change quickly, so staying informed with the latest data is essential.