USD/JPY Forecast — 2 August 2026
Time Zone: GMT +4
Time Frame: 4 Hours (H4)
Fundamental Analysis:
With no scheduled economic calendar events provided in the current data, market participants tracking USD/JPY (USDJPY) are focusing on technical momentum and price structure across the H4 chart. Fundamental drivers remain tied to general sentiment surrounding the pair as traders monitor potential macroeconomic catalysts.
Price Action:
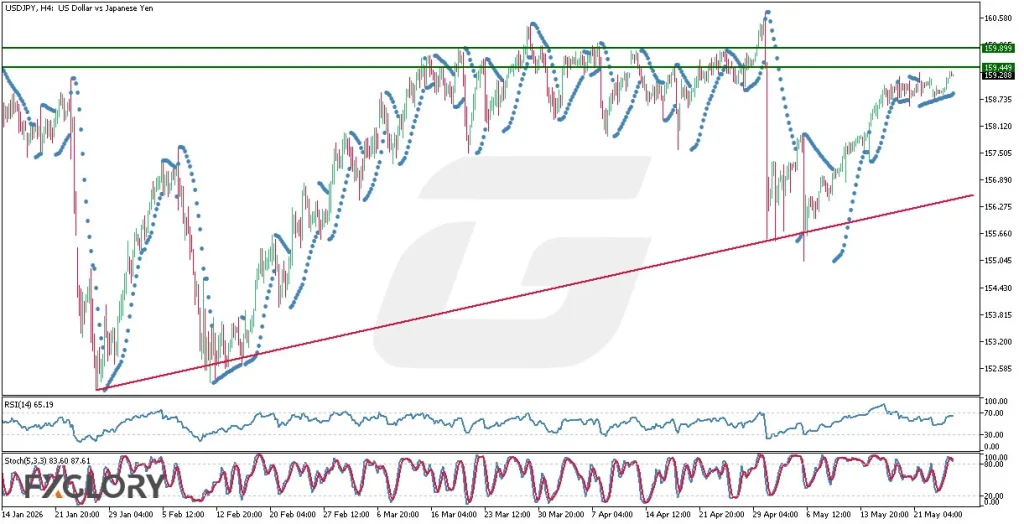
On the H4 chart, USD/JPY has observed a sharp downward shift, moving from recent peaks near the 163.973 resistance level down to test a low of 157.972. The pair subsequently recovered slightly to settle at a last close of 159.354, reflecting strong recent selling pressure and volatility.
Key Technical Indicators:
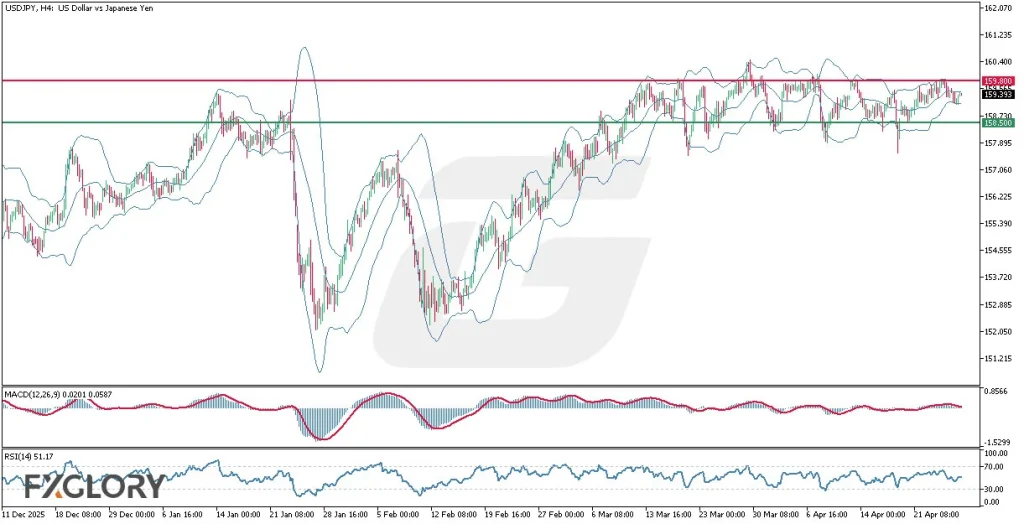
Bollinger Bands(20,2.000): The Bollinger Bands indicator highlights an upper band at 165.9538, a middle band at 162.2788, and a lower band at 158.6038. USD/JPY trading at 159.354 remains positioned near the lower band, indicating heightened downside expansion on the H4 timeframe.
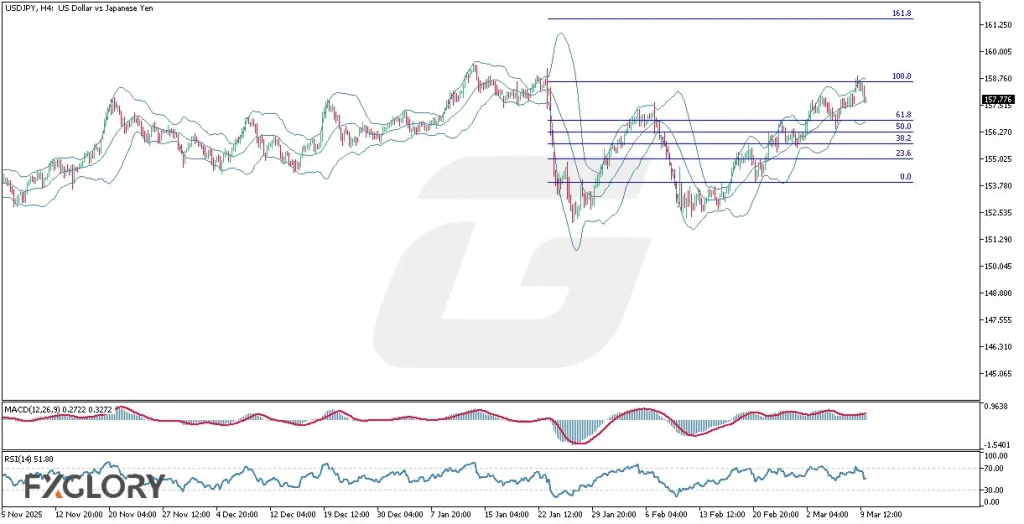
MACD(12,26,9): The MACD indicator prints a reading of -1.02298, reflecting prevailing bearish momentum for USD/JPY following the steep decline from recent highs.
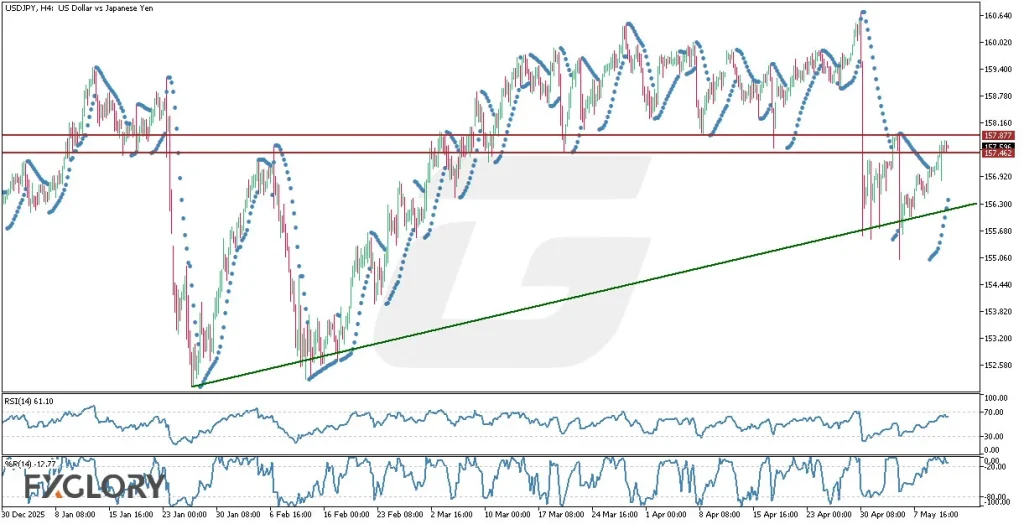
RSI(14): The 14-period RSI currently reads 32.8368, placing USD/JPY close to the oversold threshold on the H4 chart, which suggests heavy selling pressure in recent sessions.
Support and Resistance:
Key technical levels for USD/JPY include strong baseline support at 157.972 and prominent resistance at 163.973. Additional dynamic reference points include the middle Bollinger Band at 162.2788 and lower band near 158.6038.
Conclusion and Consideration:
USD/JPY (USDJPY) trades around 159.354 after retreating toward support at 157.972. With the RSI near oversold territory at 32.8368 and MACD at -1.02298, traders will watch whether the pair consolidates near current levels or moves to test key boundaries at 157.972 support and 163.973 resistance.
Disclaimer: The analysis provided for USD/JPY is for informational purposes only and does not constitute investment advice. Traders are encouraged to perform their own analysis and research before making any trading decisions. Market conditions can change quickly, so staying informed with the latest data is essential.