Time Zone: GMT +2
Time Frame: 4 Hours (H4)
Fundamental Analysis:
The USD/CAD currency pair, often referred to as the “Loonie,” mirrors the exchange rate between the U.S. Dollar and the Canadian Dollar. Key economic factors include oil prices due to Canada’s substantial crude exports, interest rate differentials set by the Federal Reserve and the Bank of Canada, and trade balance data between the U.S. and Canada. Additionally, geopolitical events and market sentiment towards the U.S. dollar globally play essential roles in influencing this pair. Recent data suggest a mixed economic outlook for both countries, potentially leading to heightened volatility in the USD/CAD exchange rate.
Price Action:
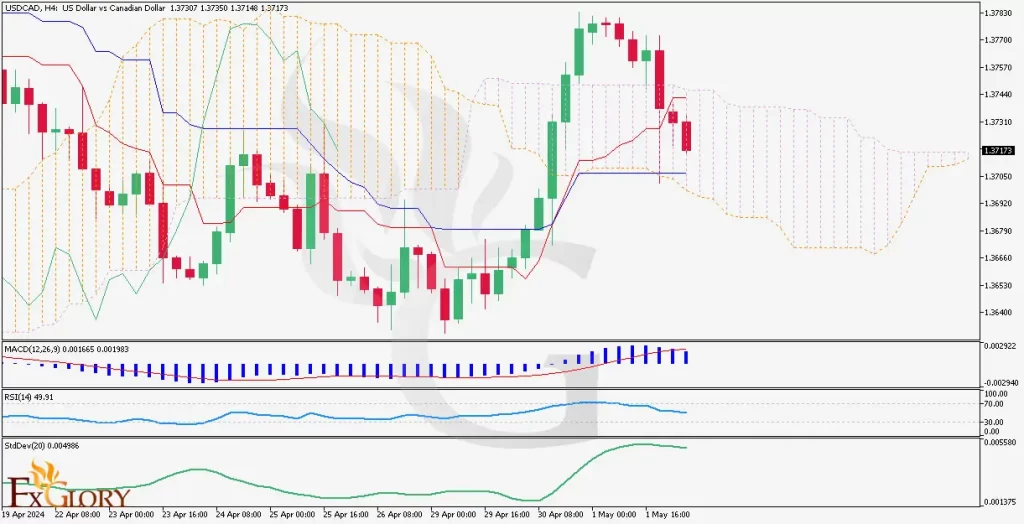
The H4 timeframe exhibits a recent pullback in the USD/CAD pair after a significant uptrend. The pair has formed consecutive bearish candles, suggesting a possible corrective phase or even a trend reversal. Despite this, the price remains within the Ichimoku cloud, indicating uncertainty in the current trend with a potential for range-bound movement until a clearer signal emerges.
Key Technical Indicators:
Ichimoku Cloud: The pair is trading within the Ichimoku Cloud, suggesting a lack of clear trend direction in the near term. The cloud acts as a support area currently but is becoming thinner, indicating potential volatility ahead.
MACD (Moving Average Convergence Divergence): The MACD histogram is trending below the signal line, demonstrating bearish momentum, but the lines are close to zero, suggesting weak momentum overall.
RSI (Relative Strength Index): RSI is near the 50 mark, which indicates a neutral momentum state and supports the idea of an indecisive market at the moment.
Standard Deviation (StdDev): A low standard deviation points to a period of low volatility, which typically suggests a consolidation phase after the recent price movements.
Support and Resistance:
Support: The initial support is around 1.3680, marking the recent lows.
Resistance: Resistance can be seen near 1.3740, aligning with the upper edge of the Ichimoku cloud and recent high points.
Conclusion and Consideration:
The USD/CAD in the H4 chart currently exhibits a period of consolidation within the Ichimoku cloud, coupled with bearish signals from the MACD and neutral RSI readings, suggesting a cautious approach. Traders should keep an eye on oil price fluctuations and upcoming economic announcements from both the U.S. and Canada, which could drive the next significant move in this pair. Market participants should prepare for possible breakouts or continuations of the trend depending on external economic influences and technical confirmations.
Disclaimer: The provided analysis is for informational purposes only and does not constitute investment advice. Traders should conduct their own research and analysis before making any trading decisions.