Time Zone: GMT +2
Time Frame: 4 Hours (H4)
Fundamental Analysis:
Bitcoin, traded against the US Dollar as BTC/USD, is influenced by a myriad of fundamental factors, including regulatory news, adoption by institutional investors, and broader economic indicators that affect cryptocurrency market sentiment. Technological advancements and network upgrades, such as improvements in blockchain scalability and security, can also affect Bitcoin’s value. Macroeconomic uncertainty, like inflation or currency devaluation, often increases interest in Bitcoin as a potential hedge. Given its status as a leading digital asset, global cryptocurrency regulatory discussions and decisions can greatly impact Bitcoin’s price movements.
Price Action:
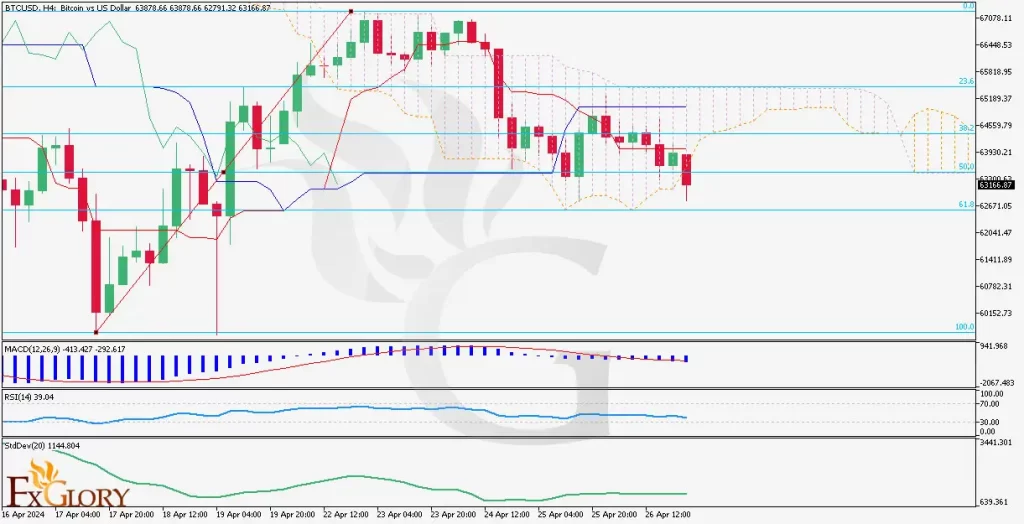
The H4 chart shows BTC/USD experiencing a period of consolidation with some bearish momentum, as evidenced by the latest red candlestick breaking below prior green candlesticks. The market seems to be attempting a recovery after a significant pullback, forming a potential base for the next directional move. The recent price movement has been constrained within a tight range, signaling indecision among traders.
Key Technical Indicators:
Bollinger Bands: The price is currently near the lower Bollinger Band, suggesting that the market could be in an oversold state, which sometimes precedes a potential upward price correction.
MACD (Moving Average Convergence Divergence): The MACD histogram is below the baseline and the MACD line is below the signal line, indicating bearish momentum in the short term.
RSI (Relative Strength Index): The RSI is near 40, suggesting bearish momentum without being in the oversold territory, implying there may be room for further downside before a potential reversal.
StDev (Standard Deviation): The increasing standard deviation indicates rising market volatility, suggesting a less stable price environment which may lead to significant price swings.
Support and Resistance:
Support: The recent low around the $63,000 area is acting as the nearest support level. A breach below could lead to further declines, with subsequent support potentially at lower Fibonacci retracement levels.
Resistance: Immediate resistance is observed at around $65,500, with stronger resistance near the $66,500 zone. The upper Bollinger Band may also act as dynamic resistance in the case of a price rally.
Conclusion and Consideration:
BTC/USD on the H4 timeframe is showing signs of bearish momentum, with technical indicators suggesting that the bearish trend could persist in the short term. However, proximity to the lower Bollinger Band could indicate a potential reversal if support holds firm. Traders should keep an eye on fundamental factors such as regulatory news and economic indicators that could impact investor sentiment. Given the current volatility, as indicated by the StDev, maintaining strict risk management strategies and looking for confirmatory signals on both the charts and fundamental news before entering trades is advisable.
Disclaimer: The provided analysis is for informational purposes only and does not constitute investment advice. Traders should conduct their own research and analysis before making any trading decisions.


