Time Zone: GMT +2
Time Frame: 4 Hours (H4)
Fundamental Analysis:
XRP, often known as Ripple, is a cryptocurrency that operates on a digital payment platform known as Ripple Net, which is on top of a distributed ledger database called XRP Ledger. XRP’s price can be influenced by regulatory news concerning cryptocurrencies, partnerships secured by Ripple with financial institutions, and the overall sentiment in the crypto market. Additionally, legal proceedings, such as the ongoing SEC lawsuit, can have a significant impact on XRP’s price. Its utility in enabling rapid and cost-effective cross-border transactions makes it sensitive to changes in international remittance volumes and financial sector technology adoption.
Price Action:
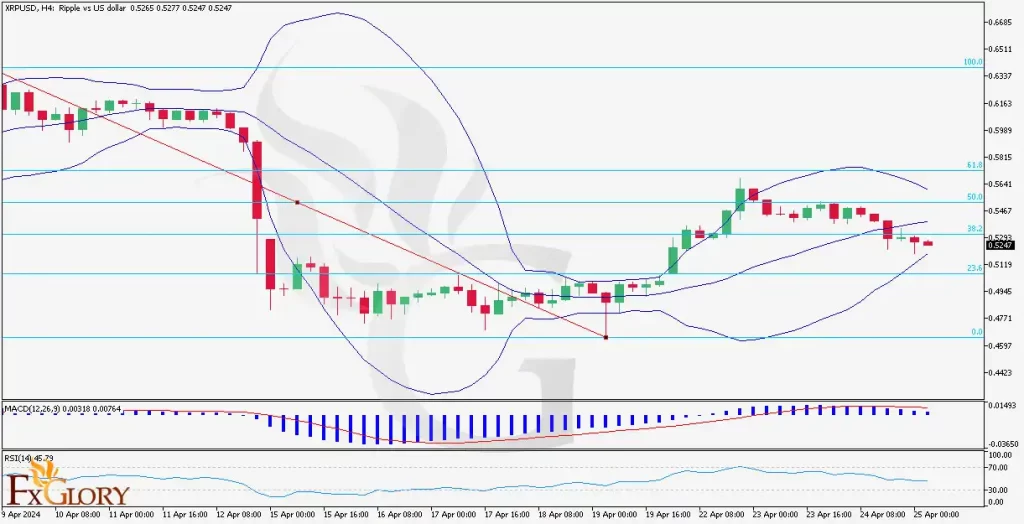
The H4 chart for XRPUSD indicates a period of consolidation following a recent uptrend. Price action has seen the formation of smaller body candles with wicks on both sides, suggesting indecision in the market. The consolidation appears to be occurring around the 38.2% Fibonacci retracement level, acting as a potential pivot point for the next directional move.
Key Technical Indicators:
Bollinger Bands: The price is trending just above the middle Bollinger Band, suggesting a neutral to slight bullish bias in the short term.
RSI (Relative Strength Index): The RSI is around the 45 mark, which is neutral territory, suggesting no clear momentum to the upside or downside.
MACD (Moving Average Convergence Divergence): The MACD histogram is positive, but the MACD line is close to the signal line, indicating that bullish momentum is not strong.
Support and Resistance:
Support: The immediate support for XRPUSD is the 38.2% Fibonacci level, followed by the lower Bollinger Band and the 23.6% retracement level.
Resistance: On the upside, the 50% Fibonacci level acts as the first resistance, with further resistance possibly at the 61.8% level and the upper Bollinger Band.
Conclusion and Consideration:
The technical setup for XRPUSD on the H4 chart suggests a wait-and-see approach as the market digests its recent gains and decides on its next move. The near-term indicators lean slightly bullish but call for caution as they show no strong momentum. Given the current consolidation phase, a breakout above the 50% Fibonacci level could indicate the resumption of the uptrend, while a fall below the 38.2% level might hint at a deeper retracement. It is crucial to consider the impact of ongoing legal challenges and macroeconomic factors influencing the cryptocurrency market when making trading decisions.
Disclaimer: The analysis provided is forinformational purposes only and should not be considered as investment advice. Market participants should conduct their independent research and exercise caution when trading in volatile markets.