Time Zone: GMT +2
Time Frame: 4 Hours (H4)
Fundamental Analysis:
The USD/ZAR pair reflects the economic dynamics between the United States and South Africa. Key fundamental factors that could influence USD/ZAR include interest rate decisions from the Federal Reserve and the South African Reserve Bank, economic data releases such as employment statistics, GDP growth, trade balances, and manufacturing data. The U.S. dollar is a primary reserve currency and is often influenced by global risk sentiment and international trade policies, while the South African rand is significantly impacted by domestic economic performances, political stability, and commodity exports, particularly precious metals.
Price Action:
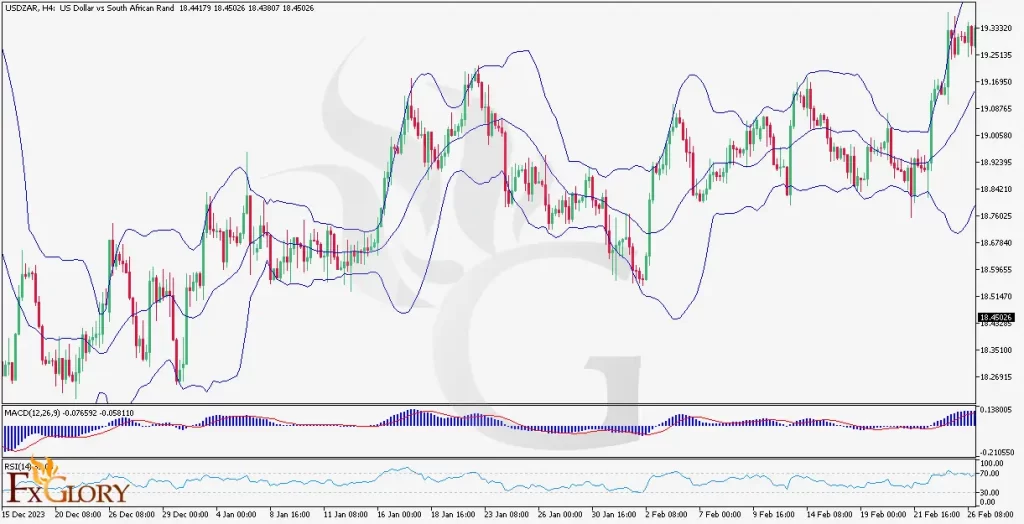
The H4 chart for USD/ZAR indicates a volatile trend with recent bullish momentum, marked by higher highs and higher lows. The price action has breached the upper Bollinger band, which might signify potential overbought conditions or a strong uptrend continuation.
Key Technical Indicators:
Bollinger Bands: The price is currently above the upper Bollinger Band, which can sometimes indicate an overextended market. However, this can also signify a strong uptrend if the price remains persistently above the band.
MACD: The MACD histogram is above the baseline, with the signal line below the histogram, which supports the bullish momentum. The divergence of the lines suggests increasing bullish strength.
RSI: The RSI is above the 50 mark, leaning towards overbought territory, which suggests strong buying pressure. However, caution should be taken if it approaches the overbought threshold of 70.
Support and Resistance:
Support: The nearest support level for USD/ZAR on the H4 chart is at the lower Bollinger Band or the most recent swing low.
Resistance: Should the bullish trend continue, the resistance may form at new highs, or profit-taking levels historically significant.
Conclusion and Consideration:
USD/ZAR shows signs of bullish continuation on the H4 chart, as suggested by the recent price action above the Bollinger Bands and the bullish MACD. Traders should monitor for potential overbought conditions given the RSI level. Any upcoming economic data from the U.S. or South Africa could further influence the pair’s direction. Given the bullish signals, traders may look for buying opportunities, keeping in mind the potential for pullbacks or corrections from overbought conditions. As always, traders should employ sound risk management strategies and consider the larger economic trends when making trading decisions.
Disclaimer: This analysis is for informational purposes only and does not constitute investment advice. Traders should conduct their own research and analysis before making any trading decisions.