Time Zone: GMT +2
Time Frame: 4 Hours (H4)
Fundamental Analysis:
The GBPNZD pair reflects the economic dynamics between the United Kingdom and New Zealand. Key factors influencing this currency pair include interest rate differentials between the Bank of England and the Reserve Bank of New Zealand, trade balance data, and geopolitical events affecting either economy. In addition, the impact of commodity prices, especially dairy products which are significant to New Zealand’s exports, and post-Brexit trade policies of the UK, play vital roles in shaping the pair’s fundamental outlook.
Price Action:
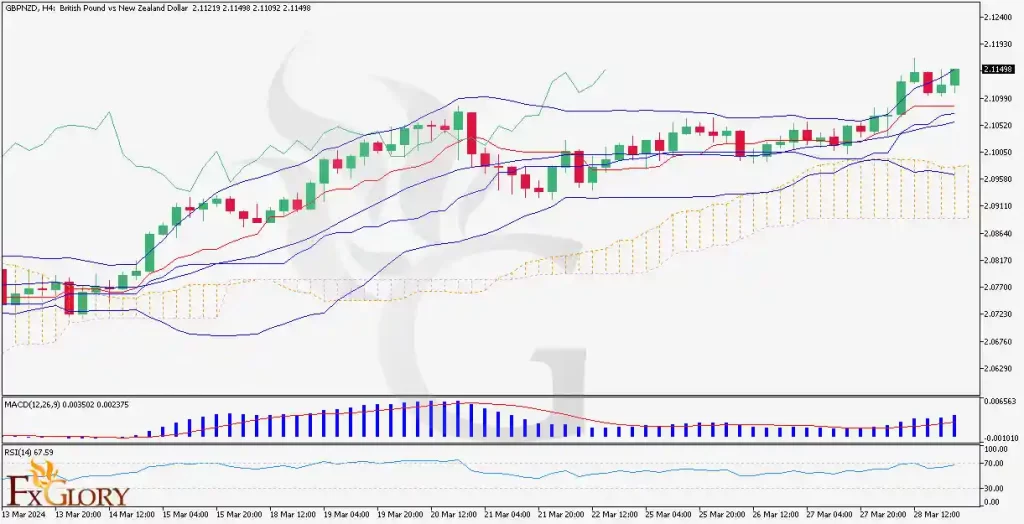
The H4 chart for GBPNZD shows a consistent uptrend, with the price sustaining above the key moving averages. The series of higher highs and higher lows suggests the presence of strong bullish momentum. The price has recently made a bullish breakout, signaling the potential for continued upward movement.
Key Technical Indicators:
Bollinger Bands: The price is trading near the upper Bollinger Band, indicating that the market is in a high volatility phase with potential resistance near the band’s edge.
Ichimoku Cloud: Price candles are above the Ichimoku cloud, and the cloud is green, suggesting that the trend is bullish and the cloud is acting as a support zone.
RSI (Relative Strength Index): The RSI is above 60, signaling strong buying pressure, although approaching overbought territory could suggest a near-term pullback.
MACD (Moving Average Convergence Divergence): The MACD histogram is above the baseline and the MACD line is above the signal line, confirming the bullish momentum in the market.
Support and Resistance:
Support: Immediate support is found at the top boundary of the Ichimoku cloud, followed by the middle Bollinger Band.
Resistance: Resistance can be anticipated at the recent high, with further resistance potentially near the upper Bollinger Band.
Conclusion and Consideration:
The GBPNZD pair on the H4 chart suggests a strong bullish trend, backed by the indicators like the Bollinger Bands, Ichimoku, RSI, and MACD. The technical outlook is supported by a bullish price action pattern. Traders should consider the impact of upcoming economic releases and any changes in monetary policy from the respective central banks, which could affect this trend. As the price is near the upper Bollinger Band and RSI indicates overbought conditions may be near, careful risk management and readiness for potential pullbacks are essential.
Disclaimer: The provided analysis is for informational purposes only and does not constitute investment advice. Traders should conduct their own research and analysis before making any trading decisions.