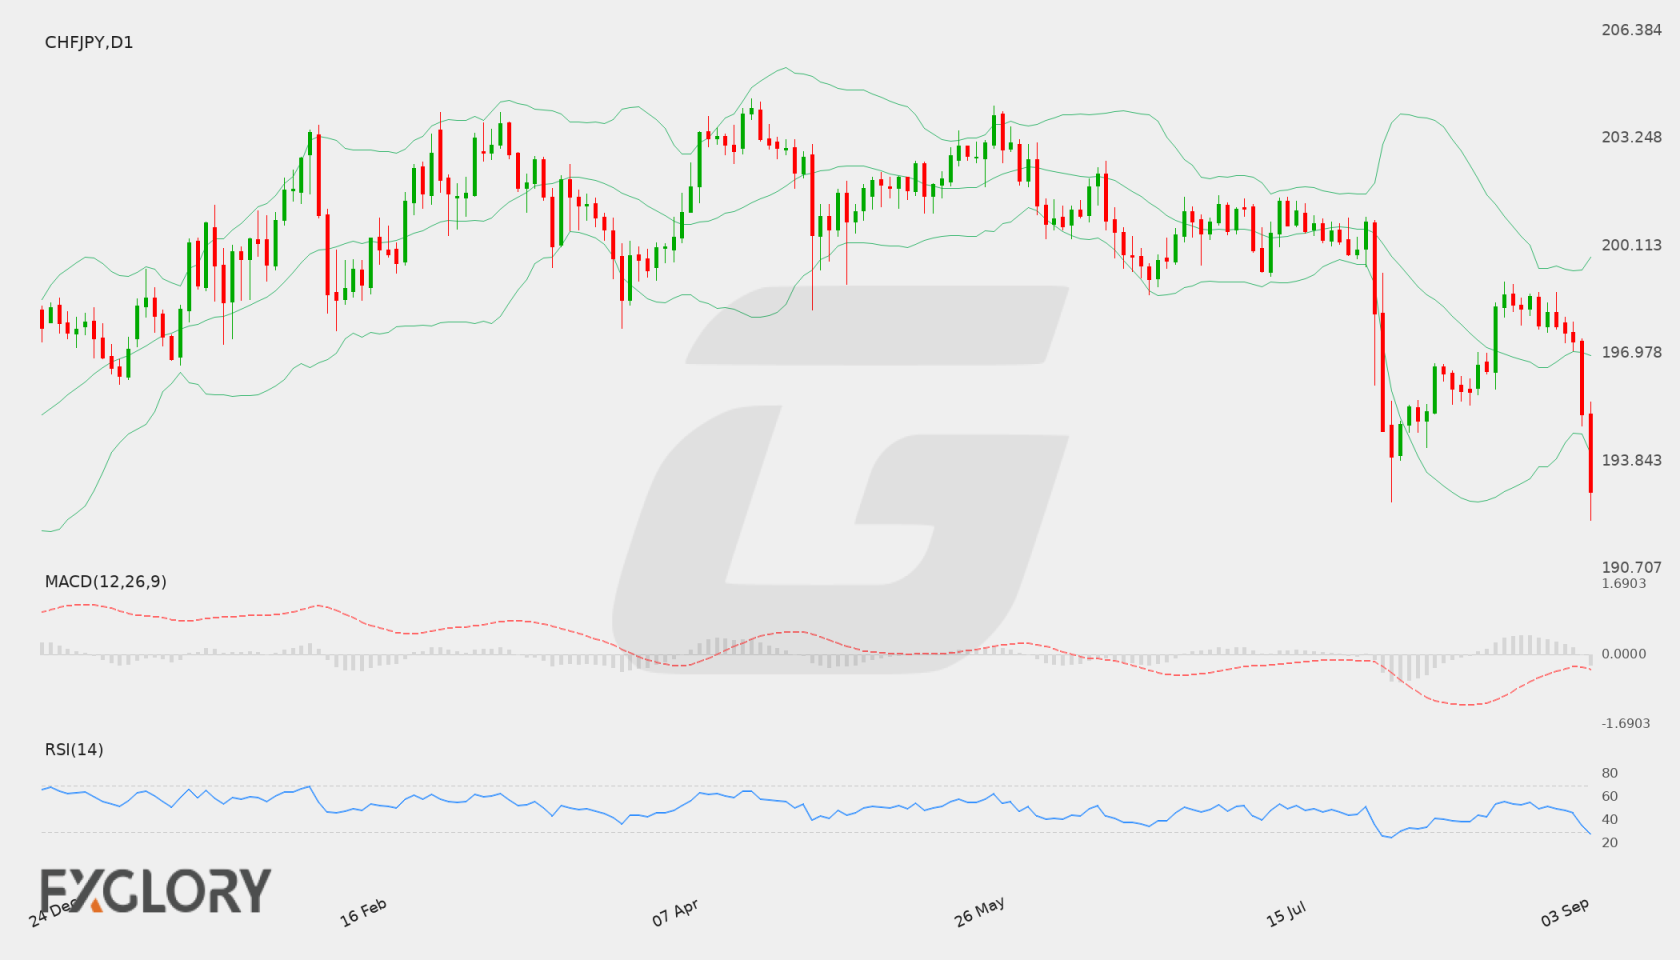
Current weekly forecast: This outlook covers 12–17 October 2026 and remains valid until 17 October 2026, unless its stated invalidation condition is triggered earlier.
Daily check — 14 October 2026: The latest completed D1 close was 190.145 on 13 October 2026. It remains below the upper formal invalidation level 192.597; the lower calibrated boundary 188.856 is an extension/confirmation boundary. The authored weekly thesis remains valid.
In brief
The weekly bias is bearish, led by D1 structure and falling trend slopes, but bullish H4 momentum and mixed signals leave room for consolidation or countertrend pressure.
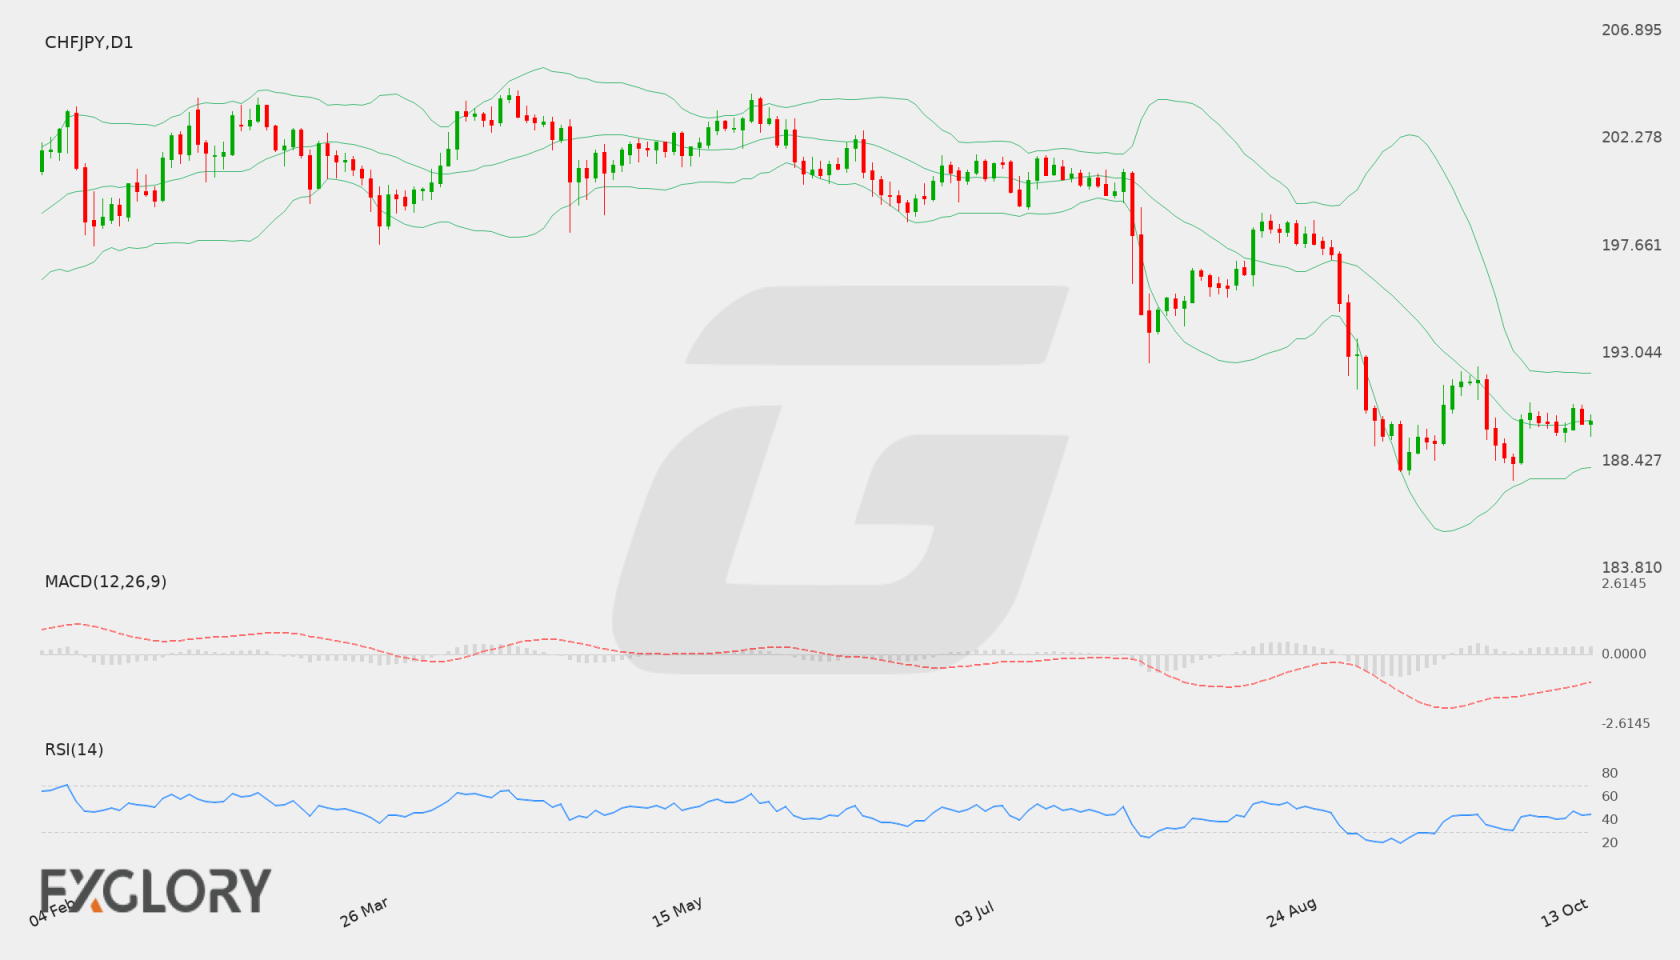
CHF/JPY closed at 190.67, above the D1 EMA20 at 190.57384 and the Bollinger middle at 190.0807, yet the broader D1 trend remains bearish with a mixed close sequence and falling EMA50 and SMA200 slopes. This creates a negative structural backdrop with some near-term stabilization evidence rather than a clean directional alignment.
The bearish case would become more relevant if price action weakens toward 189.237 and then 188.445, while the bullish H4 state currently argues for caution around immediate downside continuation. The H4 close at 190.405, positive MACD histogram and contracting volatility indicate that tactical movement may remain two-sided before the D1 structure resolves.
CHF/JPY D1 technical-analysis context for the weekly forecast. Chart data captured 14 October 2026.
CHF/JPY remains sensitive to scheduled market events and broader risk sentiment. Traders should watch high-impact calendar releases and USD movement where relevant before forming a directional view.
Price Action:
CHFJPY is trading near 190.212, with current daily movement framed by nearby support and resistance.
Key Technical Indicators:
Bollinger Bands: Price is being assessed against the 20-period Bollinger Bands, with middle band near 190.10895, upper band near 192.75895645094, and lower band near 187.45894354906.
RSI: RSI(14) is near 42.833323529699, suggesting traders should watch whether momentum holds, reaches overbought pressure, or weakens toward oversold territory.
MACD: MACD is near -1.440354442075, so momentum should be watched for continuation or loss of strength on the daily chart.
Support and Resistance:
Key support is near 187.587, while key resistance is near 201.542.
News to Watch for CHFJPY This Week:
Watch scheduled high-impact releases, central bank comments, and broader risk sentiment this week; no specific calendar events are available in current plugin data.
Weekly Outlook and Consideration:
CHF/JPY may remain guided by daily price action, support and resistance reactions, momentum indicators, and supplied calendar events. Traders should wait for confirmation around key levels and avoid assuming that current conditions guarantee the next move.
Disclaimer: The analysis provided for CHF/JPY is for informational purposes only and does not constitute investment advice. Traders are encouraged to perform their own analysis and research before making any trading decisions. Market conditions can change quickly, so staying informed with the latest data is essential.
Fundamental drivers for CHF/JPY focus on regional monetary policies and economic indicators. Key domestic inflation metrics from Switzerland and Japan provide crucial signals regarding interest rate paths and relative currency strength. Broader economic risk sentiment also plays a significant role in dictating capital flows across safe-haven currency pairs like CHF/JPY.
Price Action:
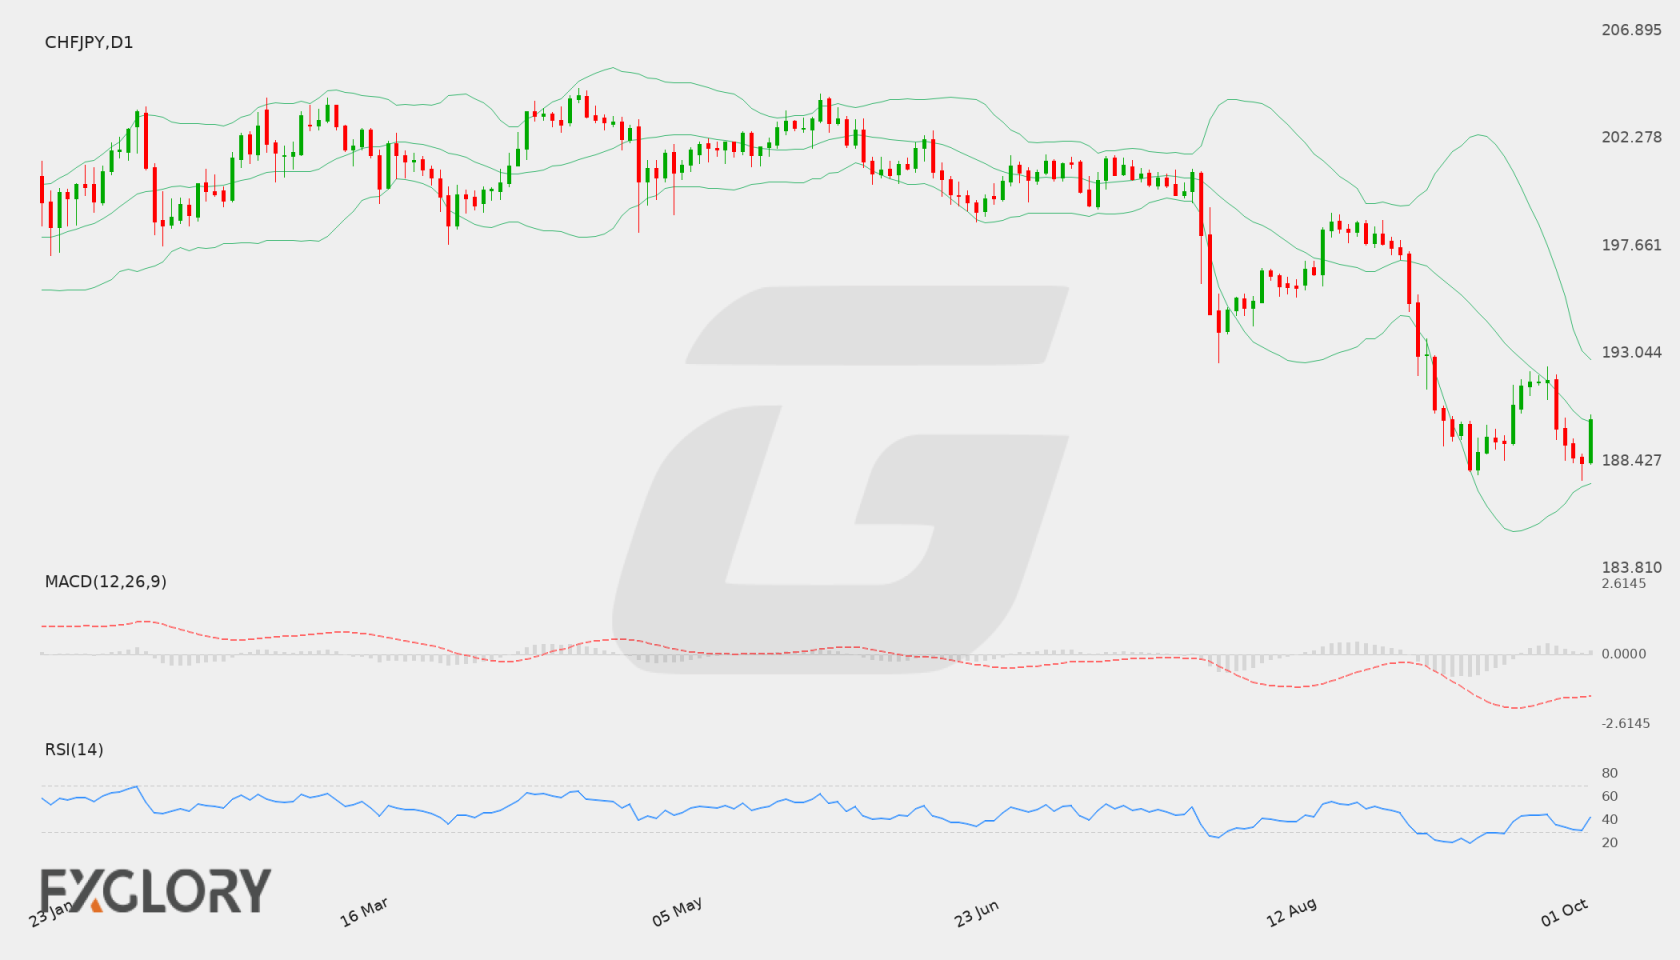
The daily (D1) chart for CHF/JPY demonstrates a strong corrective move lower over recent sessions, descending from levels near 198.636 toward a recent close of 189.214. The price recently established a trough near the 187.833 support level, reflecting sustained selling pressure across the daily timeframe.
Key Technical Indicators:
Bollinger Bands: CHF/JPY is trading in the lower portion of the daily Bollinger Bands, with the last close at 189.214 positioned below the middle band of 193.51125. The upper band is positioned at 201.48904, while the lower band lies at 185.53346, underscoring expanded downside volatility.
RSI: The 14-day RSI stands at 28.46889, placing CHF/JPY in oversold territory below the 30 threshold. While this confirms strong downward momentum, oversold conditions often indicate the potential for consolidation or corrective bounces.
MACD: The MACD indicator registers at -2.34721, operating significantly beneath the zero line. This negative reading signals active bearish momentum on the daily timeframe.
Support and Resistance:
Immediate daily support for CHF/JPY is identified at 187.833, near recent session lows. On the upside, major resistance is located at 201.573, establishing a broad daily range.
News to Watch for CHFJPY This Week:
CPI m/m: Inflation figures provide insight into domestic Swiss price pressures that can influence central bank sentiment.
Tokyo Core CPI y/y: Japanese capital inflation data serves as a key indicator for national price trends and policy expectations.
Weekly Outlook and Consideration:
CHF/JPY trades under persistent downside pressure, closing at 189.214 while sitting near key support at 187.833. With an oversold RSI of 28.46889 and a negative MACD of -2.34721, price action reflects heavy selling interest on the daily chart. Market participants will be assessing whether the pair holds above support at 187.833 or seeks lower band target zones near 185.53346, while any retracement attempts may confront initial resistance near the middle Bollinger line at 193.51125.
Disclaimer: The analysis provided for CHF/JPY is for informational purposes only and does not constitute investment advice. Traders are encouraged to perform their own analysis and research before making any trading decisions. Market conditions can change quickly, so staying informed with the latest data is essential.
The CHF/JPY pair reflects broader sentiment surrounding global risk preferences and central bank policy dynamics. Traders monitor domestic producer price metrics and Japanese monetary policy announcements for potential impacts on Swiss Franc and Japanese Yen relative strength.
Price Action:
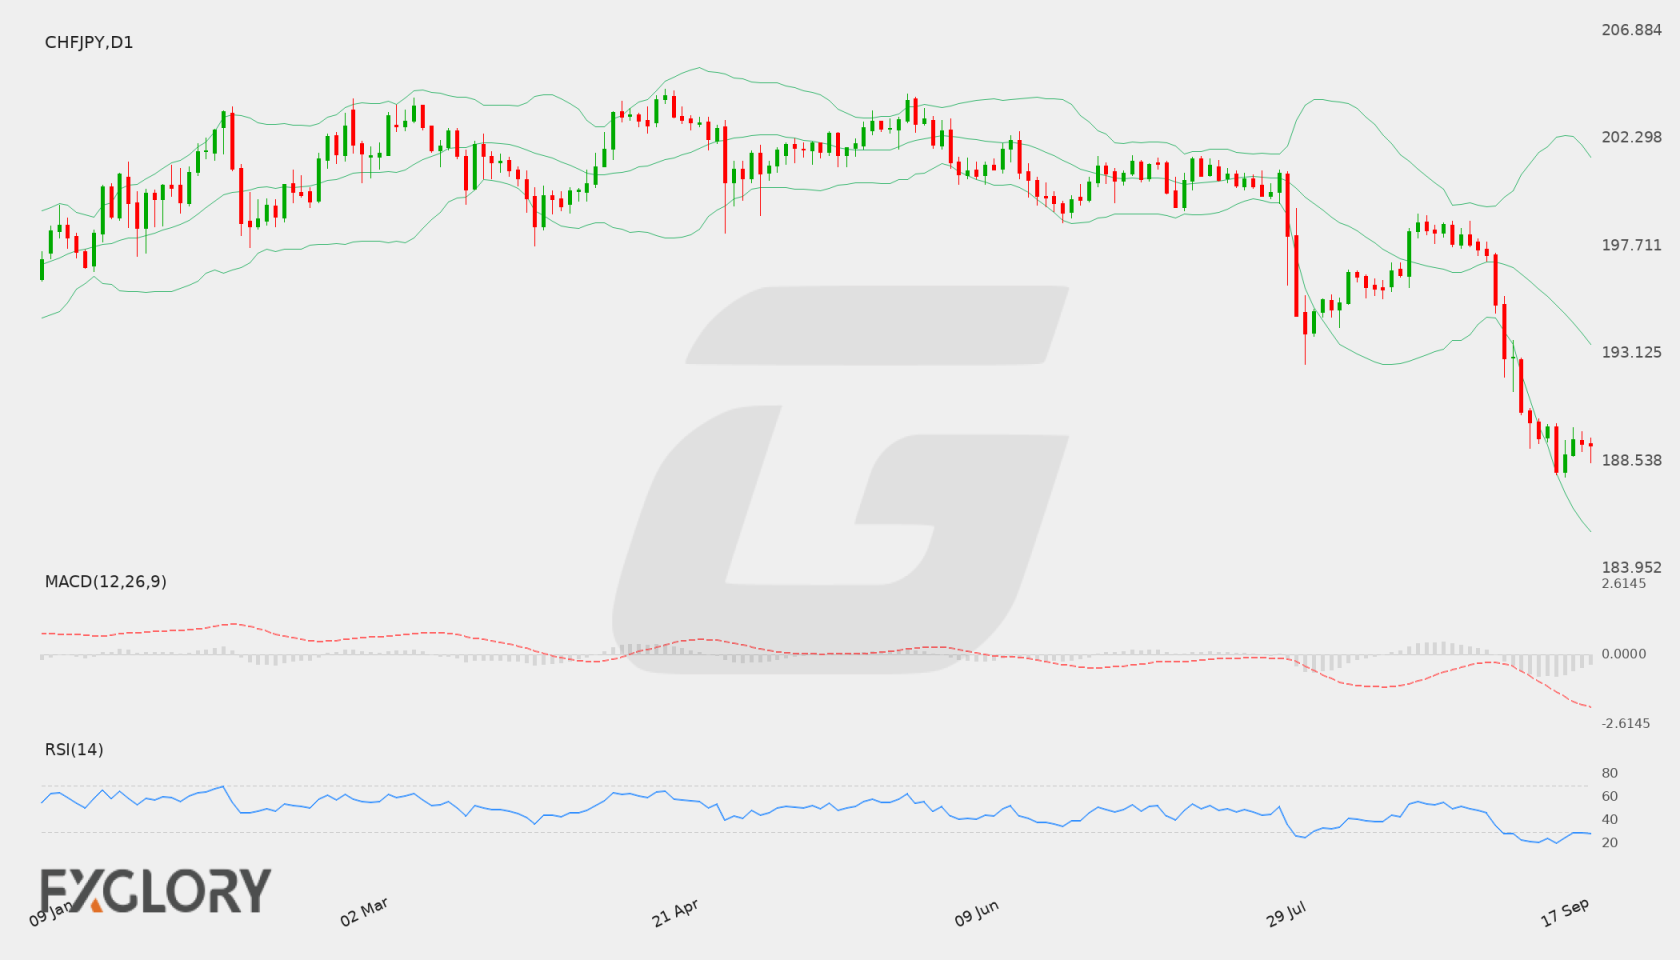
On the Daily (D1) chart, CHF/JPY has experienced a distinct downward trajectory, dropping from recent swing highs down to a close of 189.978. The series of lower daily lows highlights persistent selling pressure, though the rate recently stabilized near the 189.072 support level.
Key Technical Indicators:
Bollinger Bands: The Bollinger Bands indicate heightened volatility as CHF/JPY trades near the lower band at 189.205. The middle band sits at 195.570, while the upper band stands at 201.936, reflecting the current stretched downside move relative to the moving average.
RSI: The 14-day Relative Strength Index (RSI) stands at 23.81. This places CHF/JPY deep within oversold territory below the 30 mark, suggesting potential for a technical pause or consolidation if selling momentum exhausts.
MACD: The MACD indicator displays a negative reading of -1.993, reinforcing the prevailing bearish momentum on the daily timeframe as the signal line remains below zero without an immediate bullish crossover.
Support and Resistance:
Immediate key support is established around 189.072, aligned closely with the lower Bollinger Band. On the upside, resistance is positioned at 201.573, with the middle Bollinger Band near 195.570 serving as an intermediate hurdle.
News to Watch for CHFJPY This Week:
PPI m/m: Tracks domestic producer price changes which can influence local economic outlooks.
The D1 chart for CHF/JPY reflects strong downside momentum, taking price action down to 189.978 near key support at 189.072. While negative MACD readings confirm bearish pressure, an RSI reading of 23.81 indicates deeply oversold conditions. If 189.072 holds, a period of consolidation or corrective rebound toward the 195.570 middle Bollinger Band could develop. Conversely, a sustained breakdown below key support may open room for further losses.
Disclaimer: The analysis provided for CHF/JPY is for informational purposes only and does not constitute investment advice. Traders are encouraged to perform their own analysis and research before making any trading decisions. Market conditions can change quickly, so staying informed with the latest data is essential.
CHF/JPY remains sensitive to scheduled market events and broader risk sentiment. Traders should watch high-impact calendar releases and USD movement where relevant before forming a directional view.
Price Action:
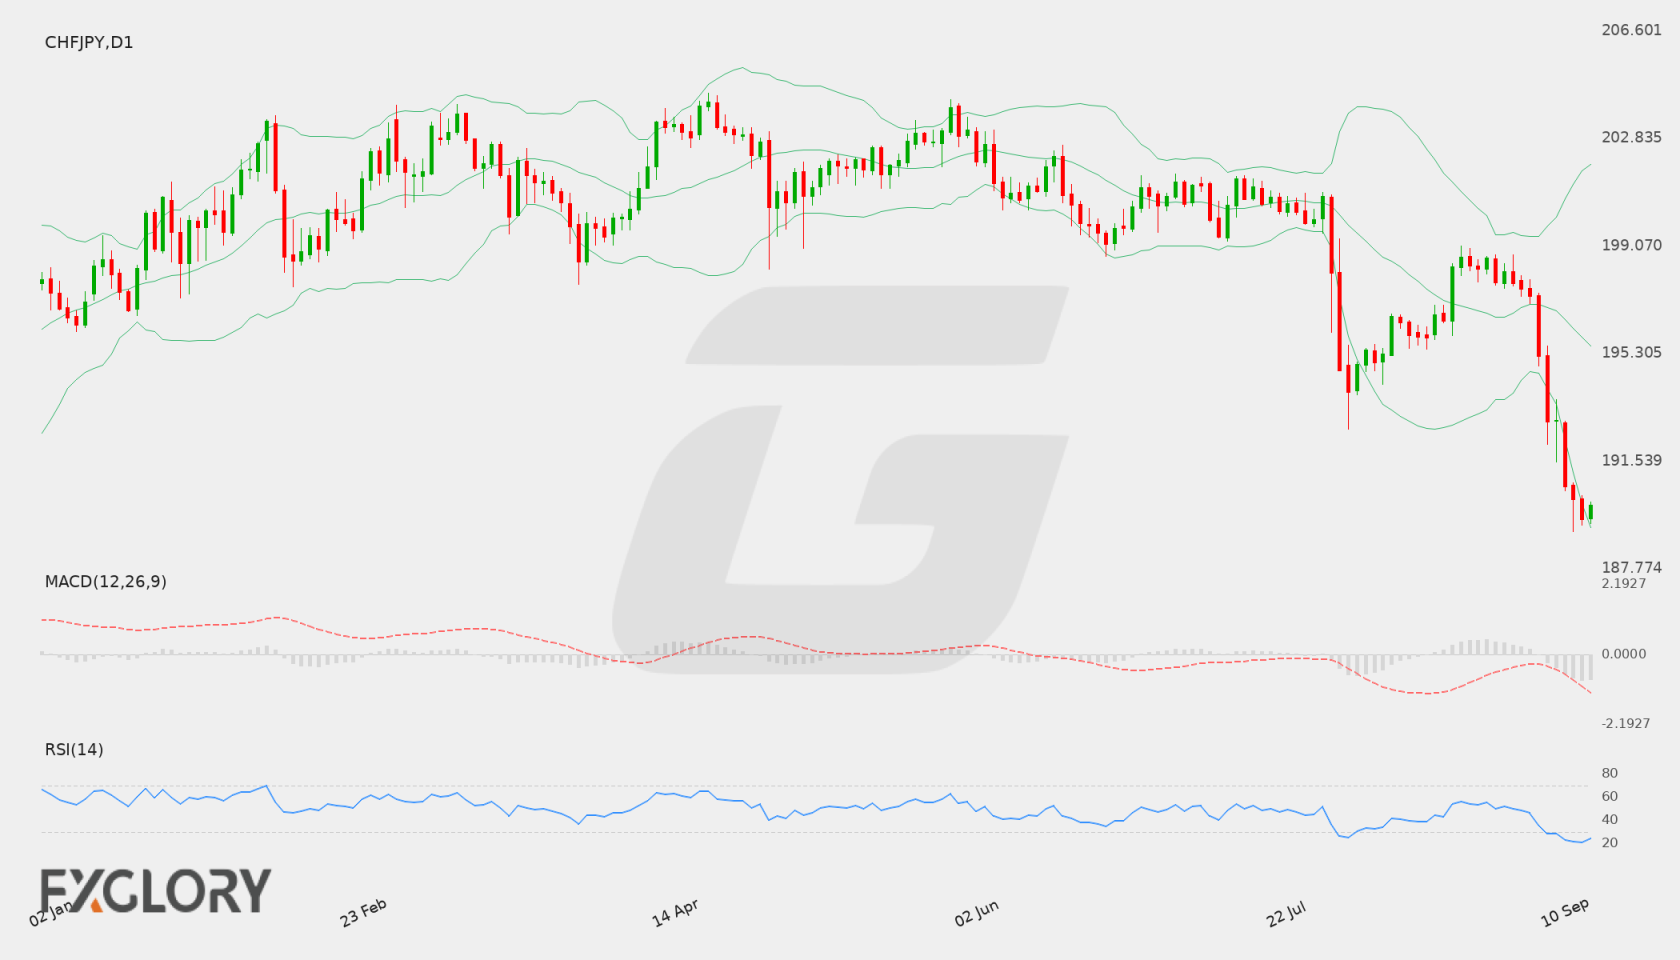
CHFJPY is trading near 192.938, with current daily movement framed by nearby support and resistance.
Key Technical Indicators:
Bollinger Bands: Price is being assessed against the 20-period Bollinger Bands, with middle band near 196.90955, upper band near 199.7733214626, and lower band near 194.0457785374.
RSI: RSI(14) is near 28.066428525947, suggesting traders should watch whether momentum holds, reaches overbought pressure, or weakens toward oversold territory.
MACD: MACD is near -0.64106806408014, so momentum should be watched for continuation or loss of strength on the daily chart.
Support and Resistance:
Key support is near 192.103, while key resistance is near 202.587.
News to Watch for CHFJPY This Week:
Watch scheduled high-impact releases, central bank comments, and broader risk sentiment this week; no specific calendar events are available in current plugin data.
Weekly Outlook and Consideration:
CHF/JPY may remain guided by daily price action, support and resistance reactions, momentum indicators, and supplied calendar events. Traders should wait for confirmation around key levels and avoid assuming that current conditions guarantee the next move.
Disclaimer: The analysis provided for CHF/JPY is for informational purposes only and does not constitute investment advice. Traders are encouraged to perform their own analysis and research before making any trading decisions. Market conditions can change quickly, so staying informed with the latest data is essential.