BTC/USD Forecast — 2 August 2026
Time Zone: GMT +4
Time Frame: 4 Hours (H4)
Fundamental Analysis:
BTC/USD is navigating market conditions with no high-impact economic events listed on the immediate calendar feed. In the absence of major macroeconomic data releases, short-term price dynamics for Bitcoin remain primarily driven by technical flows and ongoing crypto market sentiment.
Price Action:
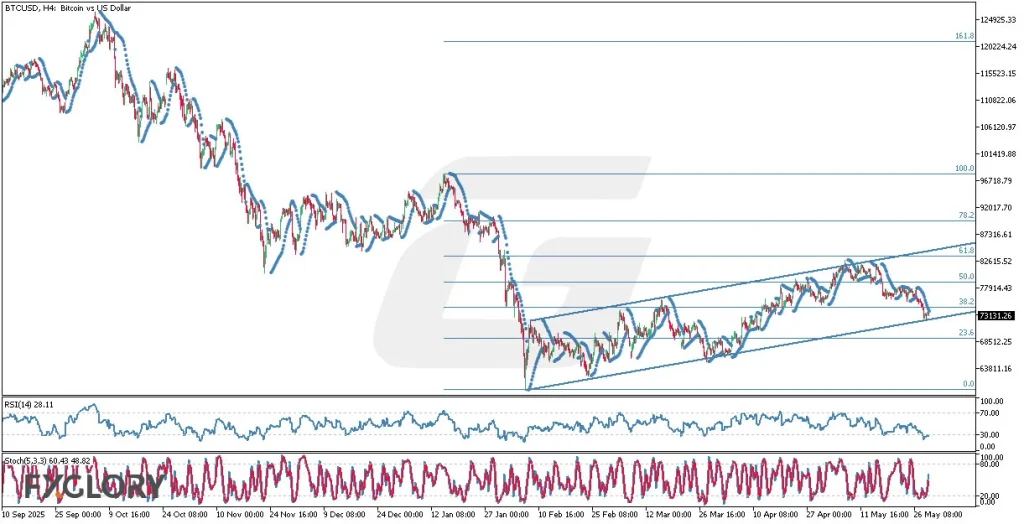
On the H4 timeframe, BTC/USD has shown notable downside movement, sliding from a high above 64,817.39 to a recent close of 62,772.66. The series of lower highs and bearish candles highlights strong selling pressure that recently pushed the price close to its support level of 62,349.86.
Key Technical Indicators:
Bollinger Bands(20,2.000): The price of 62,772.66 is currently trading below the lower Bollinger Band of 62,972.69. The middle Bollinger Band is situated at 63,971.40 and the upper band stands at 64,970.11, indicating increased downside volatility.
MACD(12,26,9): The MACD indicator is currently reading -203.02, remaining in negative territory and reflecting ongoing bearish momentum over the H4 timeframe.
RSI(14): The 14-period Relative Strength Index (RSI) stands at 33.69, hovering just above the oversold boundary of 30, which points to strong short-term seller domination.
Support and Resistance:
Key support for BTC/USD is located at 62,349.86, which marks the lower bound of recent price action. On the resistance side, the primary level is found at 66,891.02, with intermediate dynamic resistance at the middle Bollinger Band near 63,971.40.
Conclusion and Consideration:
BTC/USD exhibits a bearish trend on the H4 chart as price action pushes against the 62,349.86 support level. A breakdown below this threshold may open the door for deeper pullbacks, while holding above it could yield a temporary correction back toward the 63,971.40 region.
Disclaimer: The analysis provided for BTC/USD is for informational purposes only and does not constitute investment advice. Traders are encouraged to perform their own analysis and research before making any trading decisions. Market conditions can change quickly, so staying informed with the latest data is essential.