Time Zone: GMT +3
Time Frame: 4 Hours (H4)
Fundamental Analysis:
The USD/CAD currency pair is poised for volatility as significant economic data is anticipated from Canada. Upcoming key releases include housing starts from CMHC, consumer price index (CPI) metrics, and manufacturing sales data from Statistics Canada. These indicators will offer insights into Canada’s economic health and inflation trends, influencing the Bank of Canada’s future interest rate decisions. Additionally, today, remarks from Federal Reserve members Patrick Harker and Raphael Bostic, along with the New York Manufacturing Index and Import Price Index releases, could introduce volatility into the USD and indirectly affect USD-CAD movements.
Price Action:
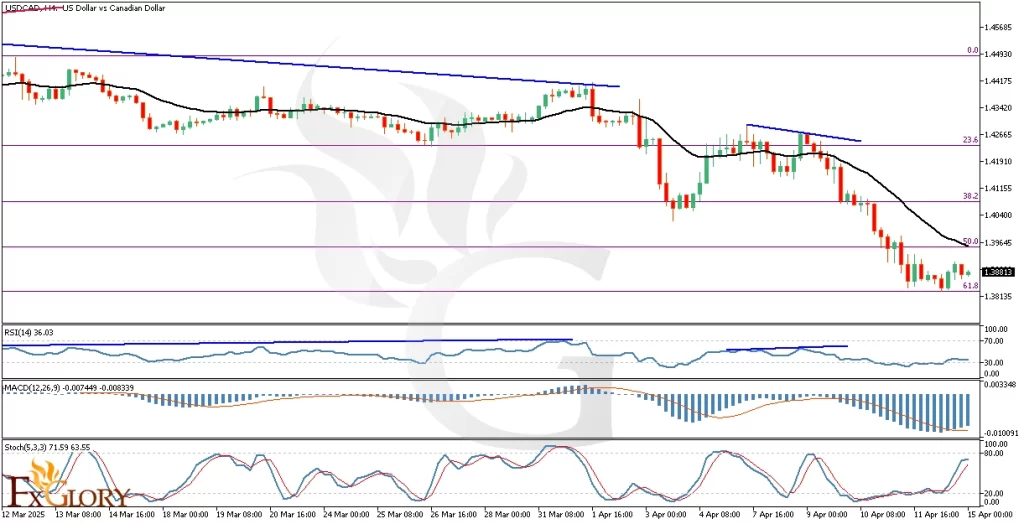
Analyzing USDCAD H4 price action, after breaking the previous ascending trend line, the pair has begun a clear downtrend. The price reacted notably at the 61.8% Fibonacci retracement level, suggesting strong buying interest. Currently, price action indicates a possible retracement towards the next resistance, which aligns with the 50% Fibonacci level and EMA 21. A noticeable divergence is observed between price action and RSI, signaling potential bullish retracement.
Key Technical Indicators:
EMA 21: The price remains below the 21-period Exponential Moving Average (EMA), affirming a bearish sentiment. The EMA currently serves as dynamic resistance, and a retest at this EMA could determine the sustainability of the downtrend.
RSI: The Relative Strength Index (RSI) registers at 36.03, showing bearish sentiment but nearing oversold territory. Notably, divergence between price and RSI signals a potential bullish correction, suggesting traders should watch for reversal signals carefully.
MACD: The Moving Average Convergence Divergence (MACD) histogram indicates bearish momentum is slowing, as bars are reducing in size. This reduction suggests sellers’ weakening control, highlighting the possibility of an upcoming bullish correction.
Stochastic: The Stochastic oscillator recently turned upwards from oversold territory, signaling short-term bullish momentum. This complements RSI’s divergence, hinting at possible short-term upside movement.
Support and Resistance:
Support: Immediate support: 1.38135 (61.8% Fibonacci retracement) and the secondary support are recent lows around 1.3770.
Resistance: Immediate resistance: 1.39645 (50% Fibonacci retracement, EMA 21) and the secondary resistance could be 1.41155 (38.2% Fibonacci retracement).
Conclusion and Consideration:
In conclusion, the technical analysis for the USD/CAD H4 timeframe indicates a bearish trend continuation with potential for short-term bullish correction based on the EMA 21, RSI divergence, MACD weakening bearish momentum, and bullish Stochastic signals. Traders should consider upcoming economic releases from Canada and remarks from Federal Reserve members, which could significantly influence volatility. Proper risk management and close monitoring of these key indicators and news events are advised.
Disclaimer: The analysis provided for USD/CAD is for informational purposes only and does not constitute investment advice. Traders are encouraged to perform their own analysis and research before making any trading decisions on USDCAD. Market conditions can change quickly, so staying informed with the latest data is essential.