Time Zone: GMT +3
Time Frame: 4 Hours (H4)
Fundamental Analysis:
Today, the US Dollar (USD) is influenced by The Conference Board’s Leading Indicators release, measuring economic direction through employment, housing, consumer confidence, and stock market trends. A higher-than-expected result could strengthen the USD. Meanwhile, the Canadian Dollar (CAD) anticipates volatility due to the release of Industrial Product Price Index (IPPI) and Raw Materials Price Index (RMPI) from Statistics Canada, significant indicators of inflation trends. Additionally, the Bank of Canada’s (BOC) Senior Loan Officer Survey results could heavily impact CAD through insights on business conditions, investments, and inflation expectations.
Price Action:
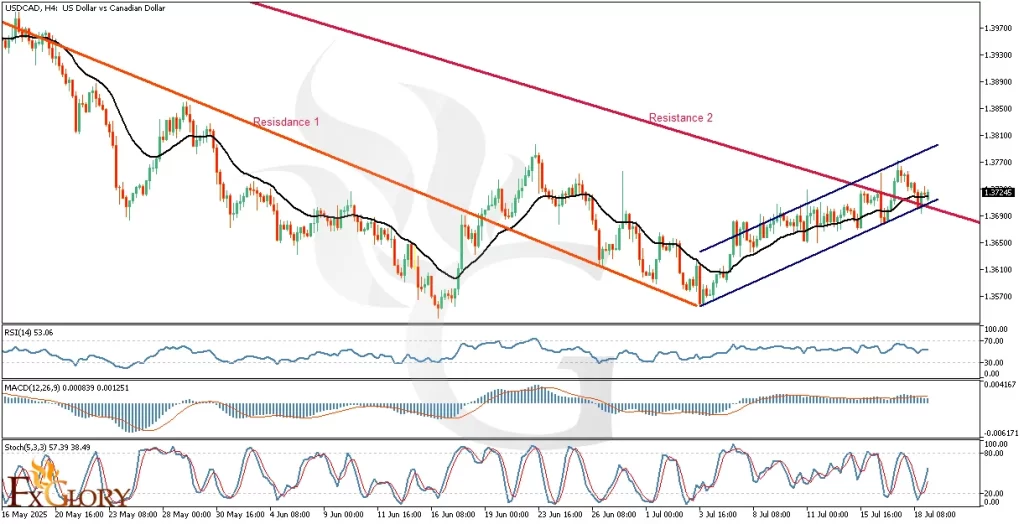
Analyzing the USD/CAD H4 timeframe, after breaking short-term resistance (Resistance 1), the price advanced towards the significant 5-month resistance (Resistance 2), moving within a clear ascending channel. Recently, the price briefly broke above this resistance and then pulled back, retesting the channel’s bottom line, confirming support. The ongoing bullish candles indicate a potential continuation upwards, supported by noticeable divergence between price and key oscillators, signaling the beginning of a bullish trend.
Key Technical Indicators:
Moving Average (21): The 21-period Moving Average acts as a dynamic support line. The USDCAD price is currently above this average, suggesting bullish momentum is maintained, offering traders confidence in long positions.
RSI (Relative Strength Index): Currently at 53.06, RSI indicates neutral to mildly bullish conditions. There’s sufficient room before reaching overbought territory, supporting the potential continuation of upward momentum.
MACD (Moving Average Convergence Divergence): MACD shows a positive but decreasing histogram, with the MACD line narrowly above the signal line. Although bullish momentum persists, traders should be vigilant for a potential weakening in upward pressure.
Stochastic Oscillator: At 57.39, the Stochastic indicator reflects moderate upward momentum, further reinforcing the current bullish stance. The crossover suggests continued bullish activity, supporting further price gains.
Support and Resistance:
Support: Immediate support is observed at the lower boundary of the ascending channel, around 1.3640. Stronger historical support appears at the previous Resistance 1 line.
Resistance: The nearest critical resistance lies at the upper boundary of the ascending channel near 1.3780, with further robust resistance at the 5-month descending trendline (Resistance 2).
Conclusion and Consideration:
The USD-CAD pair exhibits bullish signals on the H4 chart, supported by Moving Average positioning, RSI neutrality, MACD positive crossover, and a rising Stochastic Oscillator. However, traders should remain cautious due to potential volatility from key fundamental economic releases from both the USD and CAD today. It’s advisable to manage risks carefully and consider both technical and fundamental factors before entering trades.
Disclaimer: The analysis provided for USD/CAD is for informational purposes only and does not constitute investment advice. Traders are encouraged to perform their own analysis and research before making any trading decisions on USDCAD. Market conditions can change quickly, so staying informed with the latest data is essential.