Time Zone: GMT +2
Time Frame: 4 Hours (H4)
Fundamental Analysis:
The GBP/USD currency pair reflects the exchange rate between the British Pound (GBP) and the US Dollar (USD). Today’s UK Flash Manufacturing PMI fell to 44.0 (from 44.9), reinforcing concerns over a contraction in UK industrial output, while the Flash Services PMI dipped to 51.5 (from 52.5), suggesting softer service sector growth. Meanwhile, US Flash Manufacturing and Services PMIs also disappointed at 49.0 and 52.8 respectively, below forecasts, which may dampen USD demand ahead of Fed speakers Goolsbee and Waller this afternoon. Later UK events, including BOE Governor Bailey’s remarks at 21:00 and MPC Member Breeden at 11:30, could reignite pound volatility if hawkish or dovish cues emerge. Overall, mixed PMI signals and high profile central bank commentary are set to drive market volatility and directional bias in this GBPUSD H4 forex analysis.
Price Action:
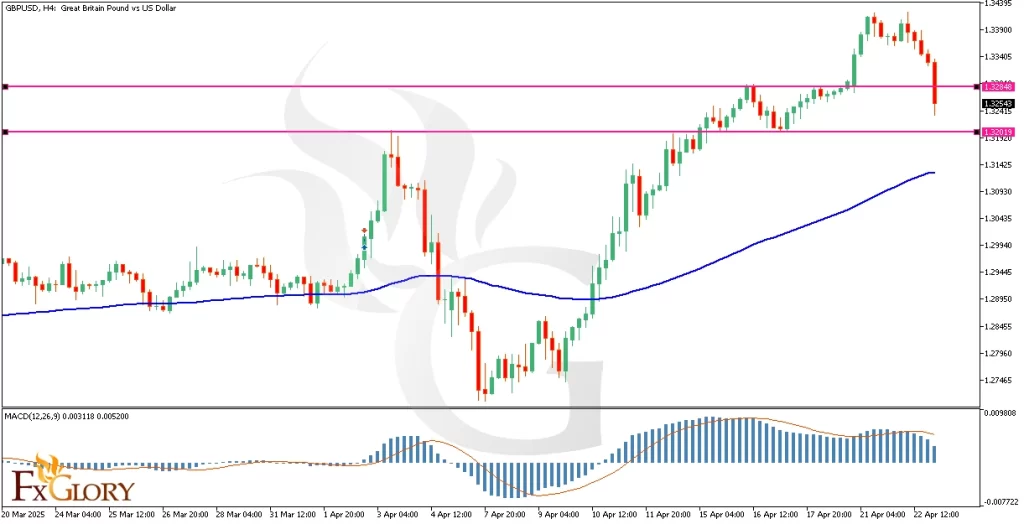
On the GBPUSD H4 chart, price action shows a decisive bullish breakout above a key resistance zone around 1.2700, confirming a shift in market sentiment. The price line is currently holding above the 100 period moving average (MA100), indicating medium term bullish momentum on the daily chart. The last three candlesticks suggest a potential pullback toward the broken resistance—now acting as support—and the MA100 before the next leg higher. This behavior underscores classic retest dynamics, often seen in professional technical analysis of forex pairs.
Key Technical Indicators:
100 Period Moving Average (MA100):The price line has recently broken above a strong resistance band and is now positioned comfortably above the MA100 on the H4 chart. This crossover signals a bullish trend in the medium term, suggesting buyers are firmly in control. Traders often view a sustained close above the MA100 as confirmation of upward momentum in GBPUSD H4 technical analysis.
MACD (Moving Average Convergence Divergence):The MACD line sits above its signal line, and the histogram bars are expanding, reflecting growing bullish power. This bullish MACD configuration aligns with the breakout, reinforcing the momentum case for GBPUSD. Watch for any narrowing of the histogram, which could herald a short term consolidation or retest before continuation.
Support and Resistance:
Support: Immediate support levels are identified at 1.32300 and 1.32000. These areas could serve as potential entry points on a pullback.
Resistance: Resistance levels are located at 1.33000 and 1.34000. A sustained break above these levels would confirm further bullish momentum.
Conclusion and Consideration:
The GBPUSD H4 technical analysis reveals sustained bullish momentum, confirmed by the MA100 breakout, bullish MACD, and supportive RSI levels. A healthy retest of the 1.2700 support—aligned with the MA100—could offer an optimal entry for buyers looking to capitalize on the next bullish wave. However, traders should exercise caution around the upcoming fundamental catalysts: US Fed speakers Goolsbee and Waller, UK BOE Governor Bailey, and PMI data that have already underperformed. Volatility spikes are likely, making strict risk management essential in this daily chart analysis for GBPUSD H4.
Disclaimer: The analysis provided here is for informational purposes only and should not be considered financial advice. Market conditions can change rapidly, and traders should perform their own research and analysis before making trading decisions. Past performance is not indicative of future results. Always trade responsibly.


