Time Zone: GMT +2
Time Frame: 4 Hours (H4)
Fundamental Analysis:
The EURUSD pair today may exhibit heightened volatility, with several key economic events scheduled for both the Eurozone and the United States. For the euro, early figures such as the French Government Budget Balance and Spanish Unemployment Change might influence sentiment, while the German 10-year bond auction could reflect market confidence in the Eurozone’s financial stability. On the U.S. front, ADP Non-Farm Employment Change and Factory Orders are critical indicators of economic momentum, and any surprise in these numbers could sway the dollar’s strength. Additional volatility could stem from speeches by President Trump and FOMC Member Kugler, as traders look for hints on future monetary policy direction. This confluence of fundamental events makes the EURUSD daily forecast highly reactive to news throughout the trading day.
Price Action:
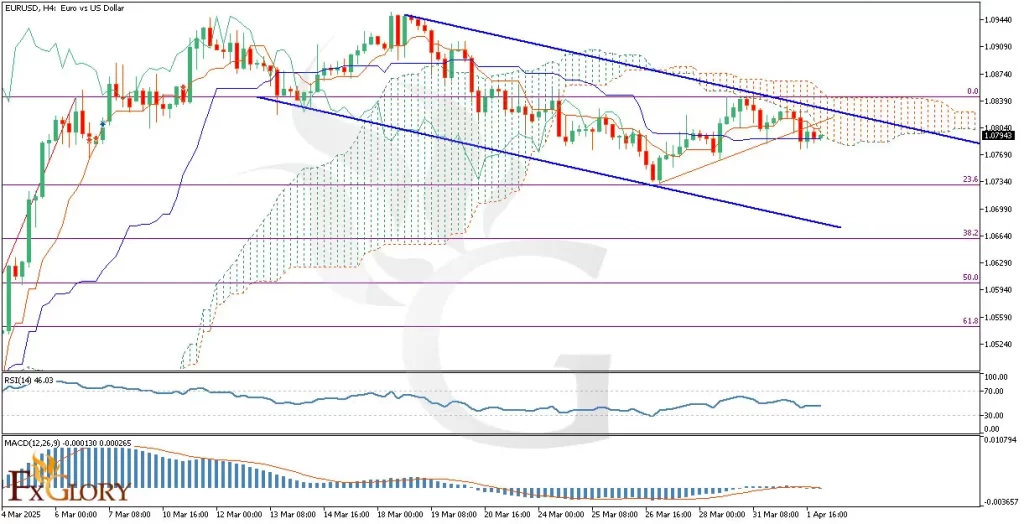
On the EURUSD H4 chart, the price continues to trend within a well-defined descending channel. The pair recently tested the upper boundary of this bearish channel and failed to break above, respecting it as a static resistance zone. Notably, the ascending support trendline from the latest bullish wave has been broken, suggesting a shift in short-term momentum toward bearish territory. The price is now consolidating around 1.07800, and a decline toward the 23.6% Fibonacci retracement level at 1.07340 is probable if bearish pressure persists. This aligns with current EUR/USD H4 chart patterns, highlighting a possible continuation of the downtrend unless significant news alters sentiment.
Key Technical Indicators:
MACD (12,26,9): The MACD histogram shows slight bullish momentum fading, while the MACD and signal lines are converging below the zero line. This could signal a possible bearish crossover soon, strengthening the case for further downside. The weakening histogram bars point to diminishing buying interest, a crucial
RSI (14): The RSI currently stands at 46.03, indicating a neutral to slightly bearish condition. It is below the 50 mark, suggesting that bears are gaining traction without yet entering oversold territory. The EURUSD RSI indicator reflects weakening momentum but room for further downside before a reversal is considered.
Ichimoku Cloud: The Ichimoku Cloud on the EURUSD H4 chart has started forming a bullish wave, with the price moving inside the cloud. The baseline (Kijun-sen) is currently at 44.3, signaling early bullish momentum, though a clear breakout is still needed for confirmation.
Support and Resistance:
Support: The 1.07285 level stands out as a critical support, aligning with the 23.6% Fibonacci retracement and serving as a potential pivot point for bullish rebounds if selling pressure subsides.
Resistance: The 1.08530 resistance marks the top of the descending channel and a recent swing high, making it a key barrier for bulls to overcome to signal a potential trend reversal.
Conclusion and Consideration:
The EURUSD technical forecast for 02.04.2025 suggests a continuation of bearish bias within the descending channel on the H4 timeframe. The break below the recent bullish trendline and rejection from static resistance zones increase the likelihood of a bearish wave toward the 1.07340 Fibonacci support. With multiple high-impact economic events lined up today for both EUR and USD, including ADP jobs data, Factory Orders, and central bank speakers, market sentiment may shift rapidly. Traders should monitor key support at 1.07285 and resistance at 1.08530 closely, adjusting their strategies accordingly based on real-time developments.
Disclaimer: The analysis provided for EURUSD is for informational purposes only and does not constitute investment advice. Traders are encouraged to perform their own analysis and research before making any trading decisions on EURUSD. Market conditions can change quickly, so staying informed with the latest data is essential.


