Time Zone: GMT +3
Time Frame: 4 Hours (H4)
Fundamental Analysis:
Today, AUD/USD traders should closely monitor key economic events affecting both currencies. USD volatility is expected as Federal Reserve Bank of Richmond President Thomas Barkin addresses monetary policy and economic outlook, which could influence market expectations about future interest rate decisions. Additionally, the release of significant economic data, including the US ISM Manufacturing PMI, Construction Spending, and JOLTS Job Openings, will provide crucial insights into the health of the US economy, potentially impacting USD strength. For AUD, important events include retail sales data and commodity price changes, crucial for gauging Australia’s economic health and the strength of the Australian dollar.
Price Action:
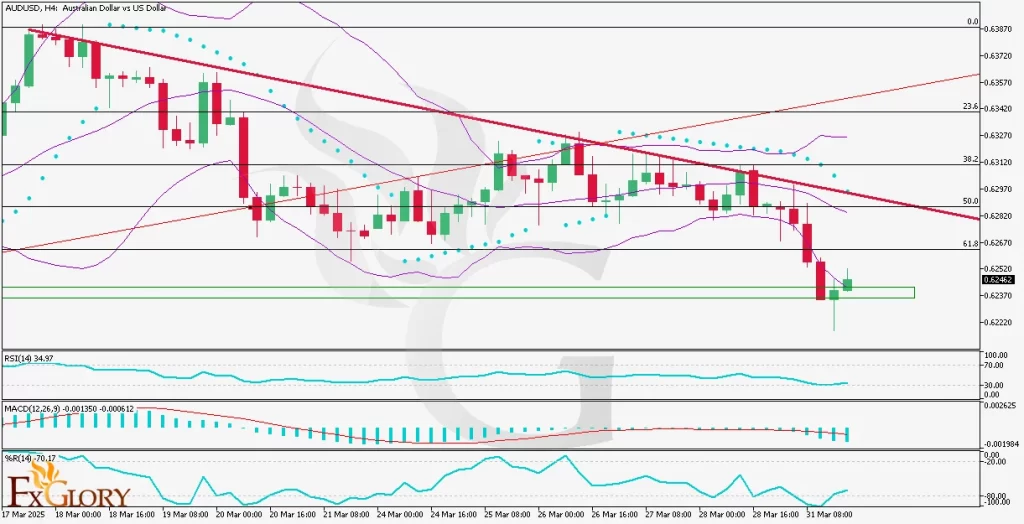
The AUD-USD H4 chart currently indicates a bearish market environment. The price recently found strong horizontal support, and a clear pin bar formation emerged at this support zone. Following the pin bar, a bullish green candle appeared, suggesting a potential move upwards toward the resistance level above for retesting. Currently, the price is near the lower boundary of the Bollinger Bands, supporting the potential for an upward price correction toward resistance levels.
Key Technical Indicators:
Bollinger Bands: The Bollinger Bands indicator on the AUD-USD H4 chart suggests the possibility of a corrective move, as the price touched the lower band. Typically, price action tends to revert towards the middle band after such scenarios. Additionally, the bands have widened significantly, implying high volatility, and may contract soon, potentially coinciding with price stabilization or consolidation.
Parabolic SAR: The Parabolic SAR dots are positioned above the price, highlighting the continuation of bearish sentiment. However, a narrowing gap between price action and these dots could soon signal a reversal if bullish momentum strengthens.
RSI (Relative Strength Index): Currently, the RSI indicator shows a reading of around 35, approaching oversold conditions. This reading signals weakening bearish momentum and suggests potential bullish corrective action in the near term.
MACD (Moving Average Convergence Divergence): The MACD histogram shows decreasing bearish momentum, indicating that sellers are losing control. A bullish crossover signal could appear soon, supporting upward corrective price action.
Williams %R: Williams %R has risen from extreme oversold territory (-70), suggesting buyers are regaining strength. A continued move upward from this level could further validate bullish sentiment.
Support and Resistance:
Support: Immediate horizontal support for AUD/USD is clearly established at around 0.62370, evidenced by recent price action and pin bar formation.
Resistance: The nearest resistance is identified around the Fibonacci 61.8% retracement at approximately 0.62670. A breakout above this level could target higher resistance areas near the 0.62820 level.
Conclusion and Consideration:
In conclusion, the AUD VS. USD H4 analysis indicates bearish sentiment currently prevails; however, technical indicators strongly support potential bullish corrective action. Traders should closely monitor today’s key US and Australian economic releases and Fed speeches for volatility catalysts. Risk management remains critical due to anticipated market sensitivity.
Disclaimer: The analysis provided for AUD/USD is for informational purposes only and does not constitute investment advice. Traders are encouraged to perform their own analysis and research before making any trading decisions on AUDUSD. Market conditions can change quickly, so staying informed with the latest data is essential.