Time Zone: GMT +2
Time Frame: 4 Hours (H4)
Fundamental Analysis:
The GBPUSD currency pair remains a key focus for traders navigating both UK and US economic shifts. Today, significant UK inflation data was released, with CPI y/y holding steady at 3.0%, while Core CPI came in slightly lower than forecast at 3.6%, suggesting inflationary pressures may be softening. RPI and HPI also declined marginally, which could reduce pressure on the Bank of England to raise rates aggressively. Adding to the volatility, the UK government’s Annual Budget Release is due later today, which may trigger fiscal policy changes impacting GBP sentiment. On the US side, market attention shifts to Core Durable Goods Orders, which came in at 0.2% versus a flat forecast, and Durable Goods Orders dropped by -1.1%, under expectations. Meanwhile, upcoming FOMC speeches and Crude Oil Inventories data may introduce short-term fluctuations in USD value. This mixed data outlook underpins a cautious tone in today’s GBPUSD H4 fundamental chart analysis.
Price Action:
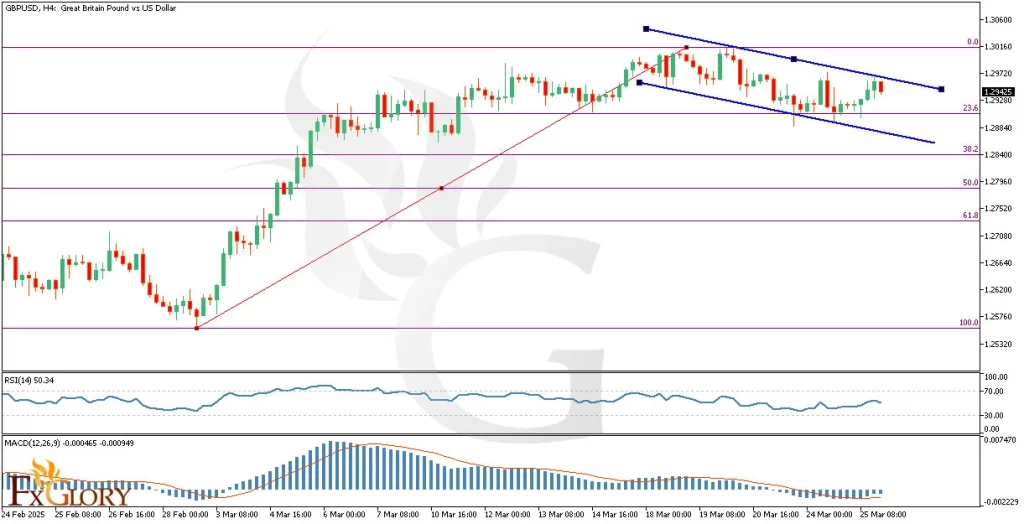
The GBPUSD H4 chart reveals a textbook price action setup. After a strong bullish impulse that lifted the pair above the 1.30 psychological zone, price corrected and entered a bearish flag channel, showing signs of consolidation and exhaustion. The price has tested the 23.6% Fibonacci retracement level twice but failed to close convincingly below it, highlighting it as a key pivot zone. Now, GBPUSD is attempting a third break beneath this level, and a successful move could accelerate downside momentum. The current structure fits within a bearish continuation pattern following an impulsive move up—often a signal that more downside correction is likely in the short term.
Key Technical Indicators:
MACD (12,26,9): The MACD histogram is marginally below the zero line, and both MACD and signal lines are in bearish alignment. This setup suggests bearish momentum may soon gain traction if the MACD begins widening negatively.
RSI (14): The RSI is currently hovering around the neutral zone (50.34), slightly tilted downward, reflecting weakening bullish momentum and potential readiness for a deeper bearish wave. If RSI dips below 45, it would confirm increasing selling pressure.
Support and Resistance:
Support: Key support levels for GBPUSD on the H4 chart include 1.2905 (23.6% Fibonacci), 1.2825 (38.2%), and 1.2750 (50%), marking critical zones for potential bearish continuation.
Resistance: Key resistance levels for GBPUSD are 1.3010 (channel top) and 1.3060 (swing high), both acting as major hurdles for bullish continuation.
Conclusion and Consideration:
In conclusion, the GBPUSD pair, as observed on the H4 chart, is entering a sensitive zone where momentum indicators and price structure suggest potential bearish continuation. The combination of soft UK inflation data and cautious US economic indicators adds weight to this bearish sentiment. The bearish flag pattern, repeated tests of Fibonacci support, and weakening RSI and MACD signals all point to a possible breakdown scenario. However, traders should remain cautious ahead of the UK Annual Budget Release and FOMC member speeches which may cause sharp intraday volatility. This GBPUSD H4 technical and fundamental analysis highlights the importance of monitoring upcoming price action around the 23.6% Fibonacci level as a decision point.
Disclaimer: The analysis provided for GBP/USD is for informational purposes only and does not constitute investment advice. Traders are encouraged to perform their own analysis and research before making any trading decisions on GBPUSD. Market conditions can change quickly, so staying informed with the latest data is essential.