USD/CAD Forecast — 18 May 2026
Time Zone: GMT +3
Time Frame: 4 Hours (H4)
Fundamental Analysis:
The USDCAD H4 technical and fundamental analysis is expected to remain highly influenced by both US economic sentiment data and reduced Canadian market liquidity conditions. On the USD side, traders are monitoring the upcoming NAHB Housing Market Index and Treasury International Capital (TIC) data, both of which provide insight into economic confidence and foreign investment demand for US assets. Stronger-than-expected US economic releases could further support the US Dollar and strengthen the bullish momentum in the USDCAD price action. Meanwhile, Canadian banks are closed in observance of Victoria Day, which may reduce CAD liquidity and create irregular volatility conditions in the forex market. Overall, the current USDCAD daily analysis suggests that stronger USD fundamentals combined with weaker CAD liquidity conditions may continue supporting bullish pressure on the pair.
Price Action:
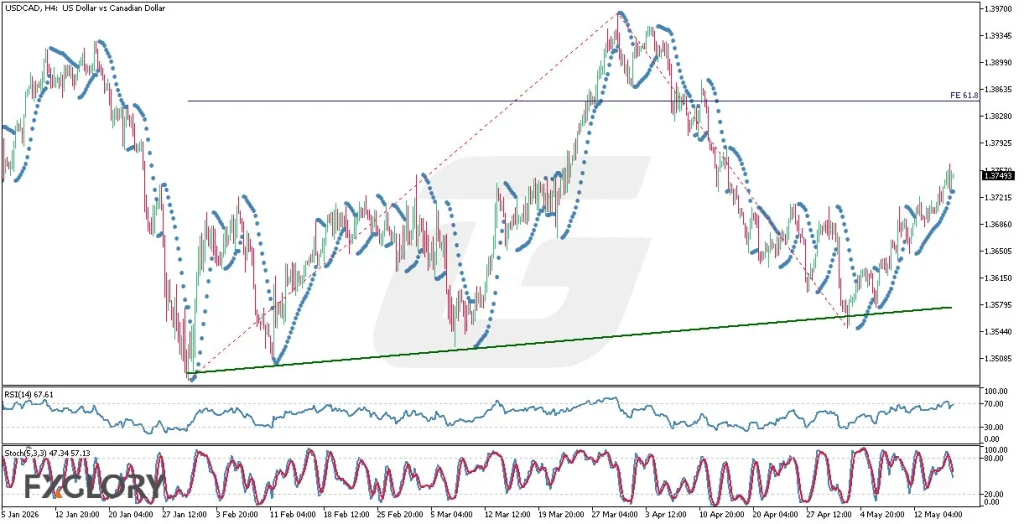
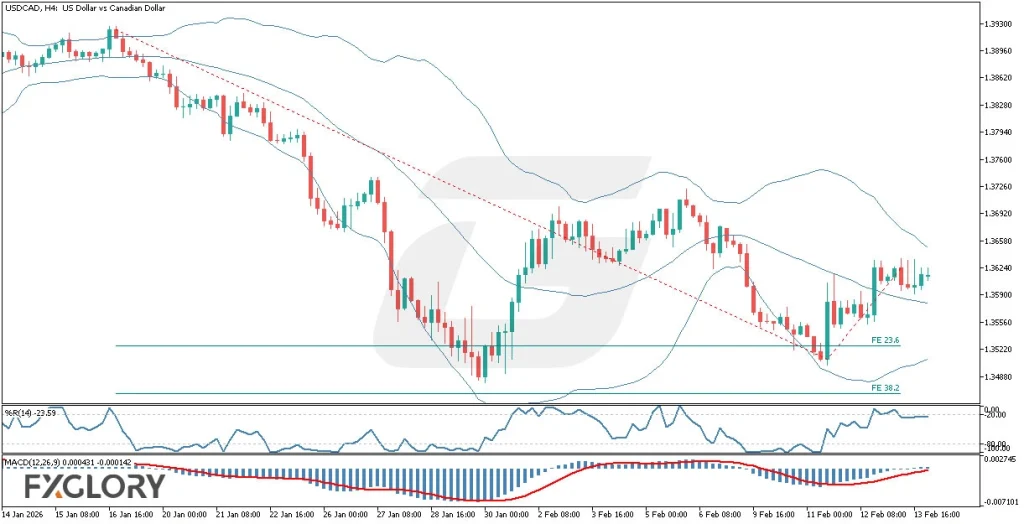
The USDCAD H4 price action analysis shows that from the recent lowest levels of the chart, the candles have been respecting a gradually rising support trendline, bouncing upward each time they approach it. More recently, bullish momentum has accelerated significantly, with stronger consecutive bullish candles pushing the pair higher at a faster pace. This shift in momentum suggests that buyers are increasingly dominating the market structure. Additionally, the current bullish recovery appears to be targeting the Fibonacci Expansion resistance zone, where the 61.8 Fibonacci level near 1.38365 becomes a major upside objective. As long as the ascending support trendline remains intact, the broader bullish outlook in this USDCAD H4 forecast may continue.
Key Technical Indicators:
Parabolic SAR: The Parabolic SAR dots remain positioned below the candles, confirming that bullish momentum is still active in the current trend. This indicator continues supporting the possibility of further upside continuation in the USDCAD H4 chart analysis.
RSI (14): The RSI currently stands at 67.61, indicating strong bullish momentum while remaining slightly below overbought territory. This suggests that buyers still have room to push the pair higher before stronger exhaustion signals emerge.
Stochastic (5,3,3): The Stochastic indicator readings at 47.34 and 57.13 reflect recovering bullish momentum after recent consolidation. The upward crossover supports the current positive movement and indicates strengthening buying pressure.
Support and Resistance:
Support: The nearest support level is located around 1.35795, aligning with the ascending support trendline that has repeatedly supported bullish rebounds.
Resistance: The immediate resistance zone appears near 1.38365, corresponding with the Fibonacci Expansion 61.8 level and previous market rejection area.
Conclusion and Consideration:
The overall USDCAD H4 technical analysis and price action forecast remains bullish as the pair continues respecting its ascending support trendline while gaining stronger upward momentum. Technical indicators including the Parabolic SAR, RSI, and Stochastic oscillator continue favoring buyers and support the possibility of additional upside movement toward the Fibonacci 61.8 expansion level. Fundamentally, stronger US economic expectations alongside reduced Canadian liquidity conditions due to Victoria Day may further increase volatility and strengthen bullish continuation scenarios. However, traders should still monitor price behavior near the major Fibonacci resistance zone, as temporary pullbacks or consolidation may occur before any sustained breakout develops.
Disclaimer:The analysis provided for USD/CAD is for informational purposes only and does not constitute investment advice. Traders are encouraged to perform their own analysis and research before making any trading decisions on USDCAD. Market conditions can change quickly, so staying informed with the latest data is essential.