Time Zone: GMT +2
Time Frame: 4 Hours (H4)
Fundamental Analysis:
Bitcoin trades against the US Dollar as BTCUSD. Key fundamental factors impacting Bitcoin include regulatory news, technological advancements, network scalability debates, and macroeconomic trends affecting the USD such as monetary policy and inflation. As a digital asset, Bitcoin is influenced by investor sentiment around its store of value and medium of exchange roles. Additionally, adoption by institutional investors and advancements in blockchain infrastructure can also drive price movements.
Price Action:
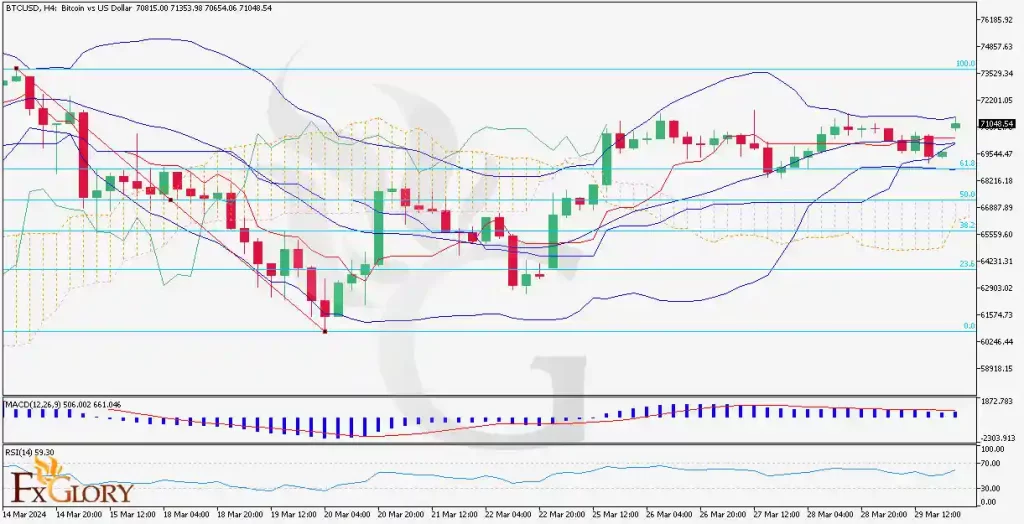
On the H4 timeframe, BTCUSD appears to have been consolidating after a significant rally. The price action is characterized by a series of higher lows, suggesting a bullish undertone. The market has formed a trading range, and the price is now fluctuating near the upper end of this range, indicating potential for an upward breakout.
Key Technical Indicators:
Bollinger Bands: Price is trading near the upper Bollinger Band, which could act as a resistance level. The bands are moderately wide, implying moderate market volatility.
Ichimoku Cloud: The price is above the Ichimoku cloud, indicating a bullish trend. The cloud may act as support in the case of a price retracement.
RSI: The Relative Strength Index is just below 60, suggesting that there is some bullish momentum, though not overextended into the overbought territory.
MACD: The MACD line is above the signal line but converging towards it, signaling weakening bullish momentum.
Fibonacci: The price has recently retraced to the 50% Fibonacci level and is now above it, which may now serve as support.
Support and Resistance:
Support: Immediate support is at the 50% Fibonacci retracement level, followed by the top of the Ichimoku cloud.
Resistance: Resistance is potentially at the upper Bollinger Band and, beyond that, near the recent high at the 61.8% Fibonacci retracement level.
Conclusion and Consideration:
BTCUSD on the H4 chart shows signs of bullish sentiment in the medium term, with the price above the Ichimoku cloud and key Fibonacci levels acting as support. The near-term bullishness is also supported by the RSI level and the MACD being in positive territory, although caution is warranted as the MACD shows signs of potential momentum loss. Given Bitcoin’s sensitivity to regulatory news and macroeconomic factors, keeping abreast of such developments is critical. Traders might look for a confirmed breakout above current resistance levels before taking a long position while being prepared to adjust to any shifts in fundamental factors that could impact market sentiment.
Disclaimer: This analysis is for informational purposes only and should not be construed as investment advice. Each trader should conduct their own research and consider their risk tolerance before making any trading decisions.