Time Zone: GMT +2
Time Frame: 4 Hours (H4)
Fundamental Analysis:
The GBPCAD pair is influenced by economic indicators and policy decisions from both the UK and Canada. Key factors include changes in global oil prices, affecting the Canadian dollar, and the UK’s economic policies, particularly around Brexit developments and trade negotiations. The pair can also be swayed by broader market sentiment and risk appetite.
Price Action:
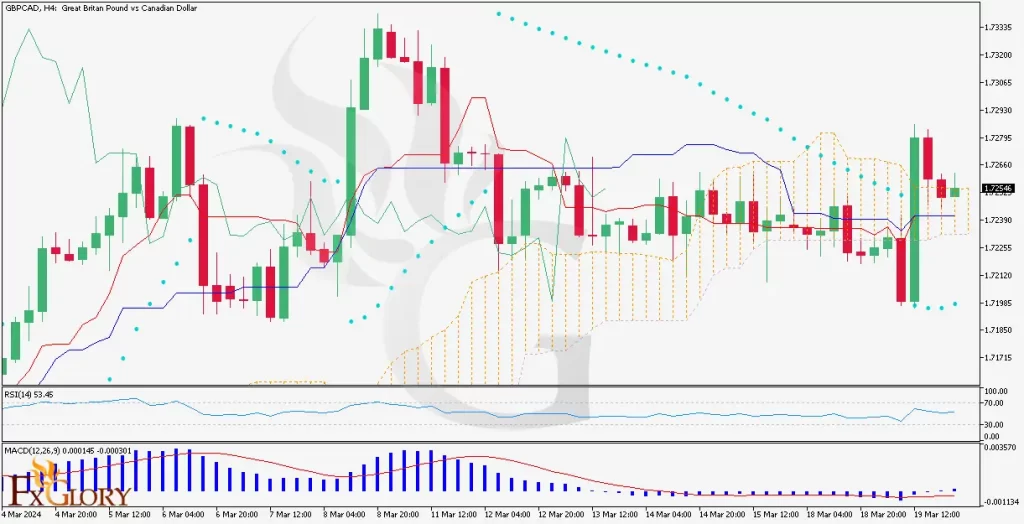
On the H4 chart for GBPCAD, we observe that the pair has been experiencing some volatility. The price shows a mix of higher highs and lower lows indicating indecisiveness in the market, but currently, it’s fluctuating around the Ichimoku Cloud, suggesting a neutral sentiment.
Key Technical Indicators:
RSI (Relative Strength Index): The RSI is near the midpoint at 53.45, suggesting neither overbought nor oversold conditions, aligning with the market’s indecision.
MACD (Moving Average Convergence Divergence): The MACD line is slightly below the signal line, and the histogram is in negative territory, which could signal bearish momentum or a potential for reversal if the MACD line crosses above the signal line.
Ichimoku Cloud: The price action is currently within the cloud, suggesting a neutral market sentiment. A break above or below the cloud could indicate the start of a new trend.
Parabolic SAR: The dots of the Parabolic SAR are above the price bars, which usually signals a bearish sentiment. Traders often look for the dots to flip below the price as an indication of a potential bullish reversal.
Support and Resistance:
Support: Look towards the most recent lows and the bottom boundary of the Ichimoku Cloud for potential support.
Resistance: Resistance might be formed at the most recent highs and the top boundary of the Ichimoku Cloud. A price breakout above the cloud could indicate bullish momentum.
Conclusion and Consideration:
The GBPCAD market on the H4 chart is in a state of equilibrium with mixed technical signals. Traders should watch for a decisive move out of the Ichimoku Cloud for clearer market direction and keep an eye on the Parabolic SAR for potential trend reversals. As always, keep abreast of oil price changes and UK economic news, which can cause swift shifts in this pair. Effective risk management is vital when navigating such uncertain market conditions.
Disclaimer: This analysis is informational and does not constitute investment advice. Traders should do their own research before making any trading decisions.