Gold Forecast — 2 August 2026
Time Zone: GMT +4
Time Frame: 4 Hours (H4)
Fundamental Analysis:
Market participants observing Gold (GOLD) encounter a period with no major scheduled economic calendar events in the provided driver list. In the absence of immediate high-impact macroeconomic releases, trading sentiment is primarily steered by technical factors and market positioning.
Price Action:
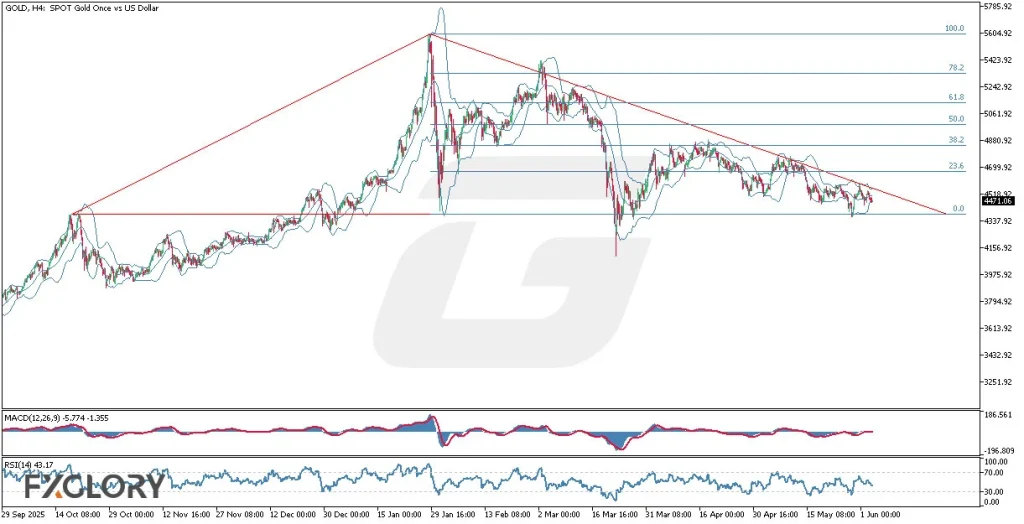
On the H4 chart, Gold (GOLD) recently retreated from highs above 4112.00 toward a low near 4025.36 before pulling back up to close at 4053.56. This movement indicates recent short-term selling pressure followed by a modest stabilization within the broader trading frame.
Key Technical Indicators:
Bollinger Bands(20,2.000): The Bollinger Bands for Gold (GOLD) display a middle band at 4053.92, an upper band at 4114.37, and a lower band at 3993.47. The last closing price of 4053.56 places the market almost directly on the middle band, signaling a period of neutral price equilibrium.
MACD(12,26,9): The MACD indicator registers a reading of 1.04. Remaining slightly above the zero line, the modest value reflects weak bullish momentum for Gold (GOLD) without a strong trend acceleration.
RSI(14): The 14-period Relative Strength Index (RSI) for Gold (GOLD) stands at 48.56. Resting near the neutral 50 threshold, the indicator underscores a balanced market environment between buyers and sellers.
Support and Resistance:
Key technical boundaries for Gold (GOLD) include critical support located at 3982.57 and key resistance positioned at 4165.86. Secondary dynamic boundaries are highlighted by the lower Bollinger Band at 3993.47 and upper Bollinger Band at 4114.37.
Conclusion and Consideration:
Gold (GOLD) trades in a consolidation phase near 4053.56 on the H4 timeframe, constrained by an RSI near 48.56 and price hovering right at the 4053.92 middle Bollinger Band. Market focus remains on how price interacts with support at 3982.57 and resistance at 4165.86.
Disclaimer: The analysis provided for Gold is for informational purposes only and does not constitute investment advice. Traders are encouraged to perform their own analysis and research before making any trading decisions. Market conditions can change quickly, so staying informed with the latest data is essential.