USD/JPY Forecast — 27 May 2026
Time Zone: GMT +3
Time Frame: 4 Hours (H4)
Fundamental Analysis:
The USDJPY H4 technical and fundamental analysis reflects a market heavily influenced by central bank expectations and monetary policy outlooks. On the JPY side, traders are closely monitoring Bank of Japan Governor Kazuo Ueda’s upcoming speech at the BOJ Institute for Monetary and Economic Studies Conference in Tokyo. Any hawkish remarks regarding inflation, interest rates, or policy normalization could strengthen the Japanese Yen and increase volatility in the USDJPY H4 forex forecast. Meanwhile, the US Dollar may also experience volatility due to speeches from Federal Reserve officials including Dallas Fed President Lorie Logan and Fed Governor Lisa Cook, alongside the release of the Richmond Manufacturing Index and labor-related data from ADP. Overall, the current USDJPY daily analysis and H4 chart outlook suggest that monetary policy expectations and central bank rhetoric remain the primary drivers for short-term price action.
Price Action:
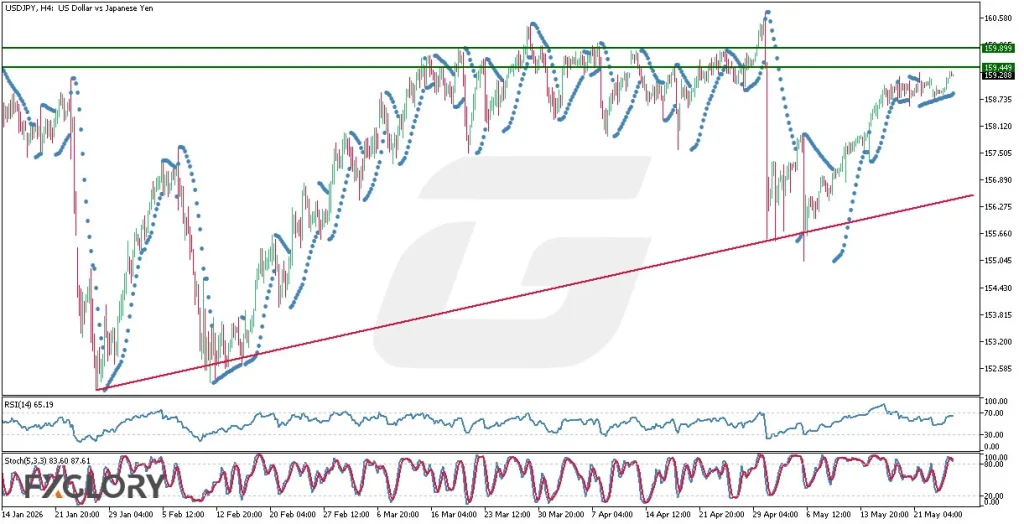
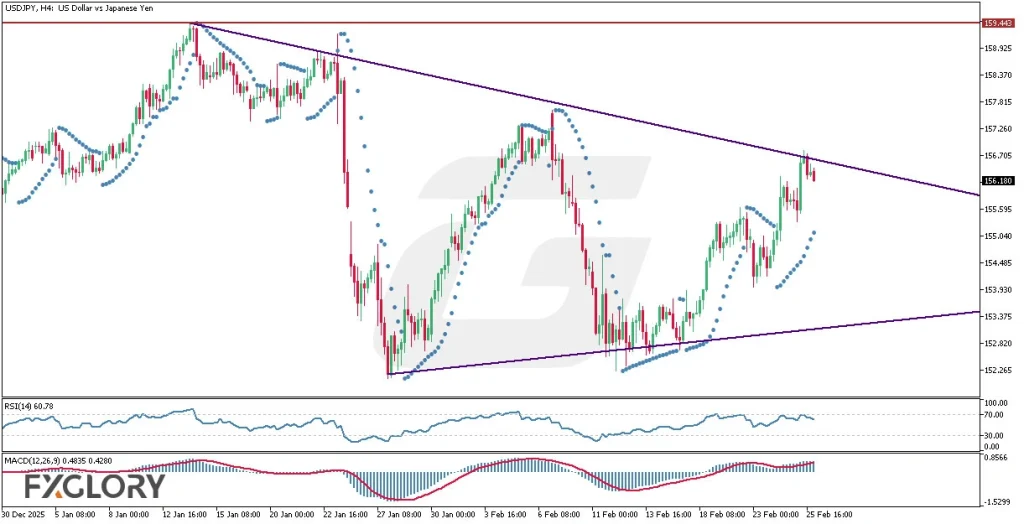
The USDJPY H4 price action analysis shows that the pair maintained a bullish structure for the majority of its recent history, steadily climbing along a rising support trendline. However, the bullish momentum faced significant resistance near the major levels of 159.899 and 159.449, preventing buyers from extending the rally further. Following a sharp bearish correction earlier in the month, the candles managed to recover and approach the resistance zone once again, but buying pressure now appears to be weakening as price stalls beneath resistance. This behavior suggests potential exhaustion among bulls, increasing the possibility of either another rejection from resistance or a period of sideways consolidation before the next directional move develops in the broader USDJPY H4 technical analysis.
Key Technical Indicators:
Parabolic SAR: The Parabolic SAR dots remain positioned below the candles, indicating that the broader bullish trend structure is still technically intact. However, the shortening distance between the dots and current price action may suggest slowing bullish momentum as the pair trades close to strong resistance levels.
RSI (14): The RSI currently stands at 65.19, reflecting relatively strong bullish momentum while approaching overbought territory. Although the indicator still supports bullish continuation in the short term, the inability to decisively break resistance may lead to bearish divergence or momentum exhaustion if buyers continue losing strength.
Stochastic (5,3,3): The Stochastic oscillator readings of 83.60 and 87.61 place the market deep within overbought territory. This condition often signals that bullish momentum is becoming overstretched, increasing the probability of a short-term pullback or corrective decline in the ongoing USDJPY H4 forex market analysis.
Support and Resistance:
Support: The nearest support level is located around 158.735, followed by the ascending trendline support near 156.275, which continues supporting the broader bullish structure.
Resistance: The primary resistance zone remains between 159.449 and 159.899, where repeated rejection candles have formed and bullish momentum has weakened significantly.
Conclusion and Consideration:
The current USDJPY H4 technical analysis and price action forecast continues showing an overall bullish structure supported by the ascending trendline and Parabolic SAR indicator. Nevertheless, repeated failures near the resistance zone at 159.449–159.899 indicate that buyers are struggling to maintain upward momentum. The overbought Stochastic readings and elevated RSI levels suggest that bullish exhaustion could trigger a corrective pullback unless a strong breakout above resistance occurs. Traders should also remain cautious of increased volatility caused by upcoming speeches from BOJ Governor Kazuo Ueda and multiple Federal Reserve officials, as central bank commentary could significantly influence the short-term direction of the USDJPY forex market.
Disclaimer: The analysis provided for USD/JPY is for informational purposes only and does not constitute investment advice. Traders are encouraged to perform their own analysis and research before making any trading decisions on USDJPY. Market conditions can change quickly, so staying informed with the latest data is essential.