Time Zone: GMT +3
Time Frame: 4 Hours (H4)
Fundamental Analysis:
The BTC/USD pair reflects Bitcoin’s price action against the US Dollar, making today’s BTC-USD H4 technical and fundamental analysis highly sensitive to US macroeconomic news, Federal Reserve commentary, and geopolitical risk sentiment. The USD side may face volatility from Federal Reserve Governor Lisa Cook’s speech, labor-market indicators such as Average Hourly Earnings, Non-Farm Payrolls, and the Unemployment Rate, plus University of Michigan consumer sentiment and inflation expectations. Stronger-than-expected jobs or inflation-related data could support the US Dollar and pressure Bitcoin price action, while weaker data may improve risk appetite and help BTC/USD recover. In addition, the reported Iran and Strait of Hormuz developments, oil-market investigations, and military headlines may increase market uncertainty, potentially creating sharp volatility across crypto, commodities, and USD pairs during today’s Bitcoin H4 chart analysis.
Price Action:
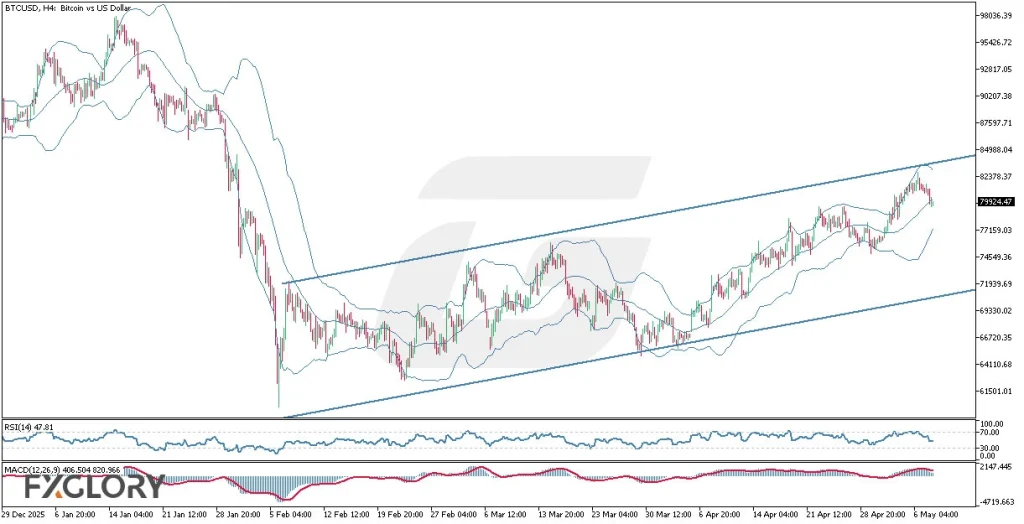
The BTCUSD H4 price action remains inside a broader ascending channel, which keeps the medium-term Bitcoin technical outlook structurally constructive. However, the latest move shows a clear rejection from the upper channel area and upper Bollinger Band resistance, followed by several bearish candles that indicate active short-term selling pressure. Price is now trading near the middle Bollinger Band around the 79,700 zone, suggesting that bullish momentum is fading after the previous rally. As long as Bitcoin stays above the channel support, the larger BTC-USD H4 trend remains upward, but the immediate price action favors a corrective phase or consolidation.
Key Technical Indicators:
Bollinger Bands: The BTC/USD H4 Bollinger Bands show a rejection from the upper band and a pullback toward the middle band, signaling weakening bullish momentum. A break below the middle band could support a deeper short-term Bitcoin correction.
MACD Moving Average Convergence Divergence: The MACD is losing strength after the recent bullish move, with momentum turning weaker. This suggests short-term bearish pressure may continue if sellers stay active.
RSI(14): The RSI is around 46, showing neutral-to-slightly-bearish BTC-USD H4 momentum. A move back above 50 would indicate buyers are trying to regain control.
Support and Resistance:
Support: Immediate support is located around 77,200, aligning with the recent pullback zone and the lower side of the short-term Bollinger Band structure.
Resistance: The nearest resistance is around 82,400, matching the recent rejection area near the upper Bollinger Band and the upper region of the ascending channel.
Conclusion and Consideration:
The BTC-USD H4 chart analysis shows a short-term bearish correction inside a larger ascending channel, with Bitcoin price action still respecting the broader upward structure. Bollinger Bands, MACD, and RSI all point to weakening bullish momentum, making the 77,200 support level important for maintaining the current BTC/USD technical outlook. A confirmed break below support could increase selling pressure toward the lower channel area, while a recovery above 82,400 would revive the bullish Bitcoin H4 forecast and may open the way toward the upper channel resistance. Traders should monitor today’s USD news, Fed commentary, labor-market data, UoM sentiment, inflation expectations, and geopolitical headlines, as these catalysts may strongly influence BTC-USD volatility, crypto market sentiment, and intraday price action.
Disclaimer: The analysis provided for BTC/USD is for informational purposes only and does not constitute investment advice. Traders are encouraged to perform their own analysis and research before making any trading decisions on BTCUSD. Market conditions can change quickly, so staying informed with the latest data is essential.