Time Zone: GMT +3
Time Frame: 4 Hours (H4)
Fundamental Analysis:
The GOLD/USD pair, also known as XAUUSD, remains sensitive to today’s USD news and geopolitical headlines, making this H4 technical and fundamental chart daily analysis important for gold price action traders. Today’s S&P Global Manufacturing PMI, ISM Manufacturing PMI, ISM Manufacturing Prices Paid, and Wards Auto Sales data may influence the US Dollar, while Strait of Hormuz and Israel-Iran headlines could support safe-haven demand for spot gold.
Price Action:
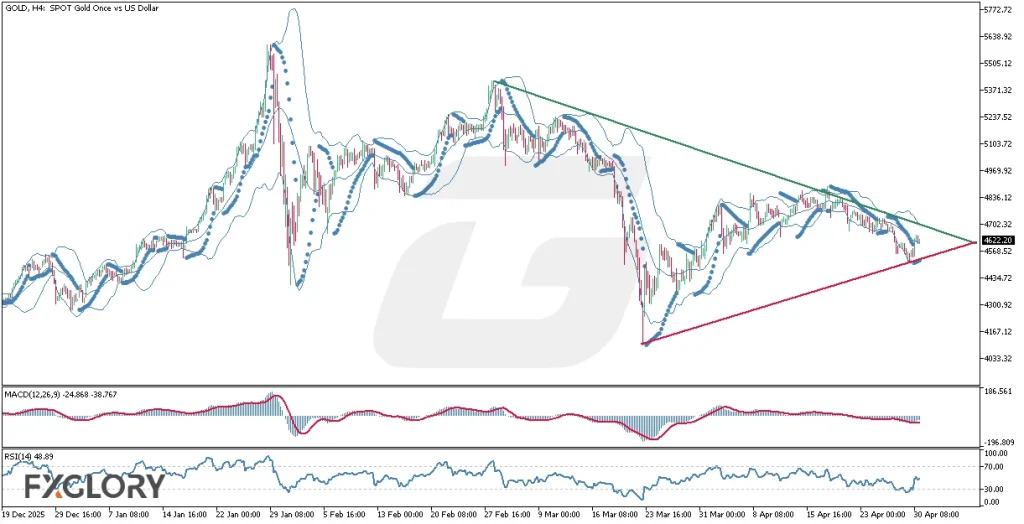
The GOLD/USD H4 chart shows gold moving inside a symmetrical triangle, with price bouncing from the rising support near the 4560–4580 zone. The descending resistance trendline continues to limit upside attempts, so XAUUSD price action remains neutral until a confirmed breakout above resistance or below support.
Key Technical Indicators:
Bollinger Bands: The Bollinger Bands are tightening on the GOLD/USD H4 chart, showing low volatility and potential breakout pressure. Price is near the middle band, confirming neutral XAUUSD momentum.
MACD: The MACD remains weak, with limited bullish confirmation despite the latest bounce. A bullish crossover would support upside continuation, while further weakness may favor sellers.
RSI: The RSI is around 49, keeping gold near neutral territory. This shows that XAUUSD is neither overbought nor oversold, leaving room for movement in either direction.
Parabolic SAR: The Parabolic SAR is currently below the candles, supporting short-term bullish pressure. However, price remains inside the triangle, so confirmation is still needed.
Support and Resistance:
Support: Immediate support is located near 4560–4580, matching the rising triangle support and recent bounce area.
Resistance: Key resistance is seen around 4700–4725, followed by stronger resistance near 4800–4840.
Conclusion and Consideration:
The GOLD H4 technical and fundamental analysis shows a neutral market structure, with gold consolidating inside a symmetrical triangle while traders wait for breakout confirmation. Momentum is mixed: MACD is still weak, Parabolic SAR is below the candles, RSI is around 49, and Bollinger Bands are tightening, signaling that a potential breakout may be approaching soon. The main bias remains neutral until breakout; a move above triangle resistance could support a bullish XAU-USD H4 chart forecast, while a drop below 4560–4580 could trigger bearish continuation. Traders should also monitor USD PMI data, ISM Prices Paid, auto sales, and geopolitical headlines for possible volatility in gold price action today.
Disclaimer: The analysis provided for GOLD/USD is for informational purposes only and does not constitute investment advice. Traders are encouraged to perform their own analysis and research before making any trading decisions on GOLDUSD. Market conditions can change quickly, so staying informed with the latest data is essential.