Time Zone: GMT +3
Time Frame: 4 Hours (H4)
Fundamental Analysis:
The GBPUSD H4 technical and fundamental analysis is expected to experience elevated volatility due to several important Bank of England and US economic events scheduled for today. For the British Pound, traders are focusing on speeches from BOE MPC members Clare Lombardelli and Alan Taylor, as any hawkish comments regarding inflation or future interest rates could strengthen GBP sentiment. In addition, the UK Construction PMI remains an important leading indicator for economic activity and business confidence. On the US side, market participants are monitoring Challenger Job Cuts, Unemployment Claims, labor cost and productivity data, as well as speeches from several Federal Reserve officials including Kashkari, Hammack, and John Williams. Since Fed commentary can significantly influence interest rate expectations, today’s GBPUSD daily analysis may see strong USD-driven volatility depending on whether officials maintain a hawkish or cautious tone.
Price Action:
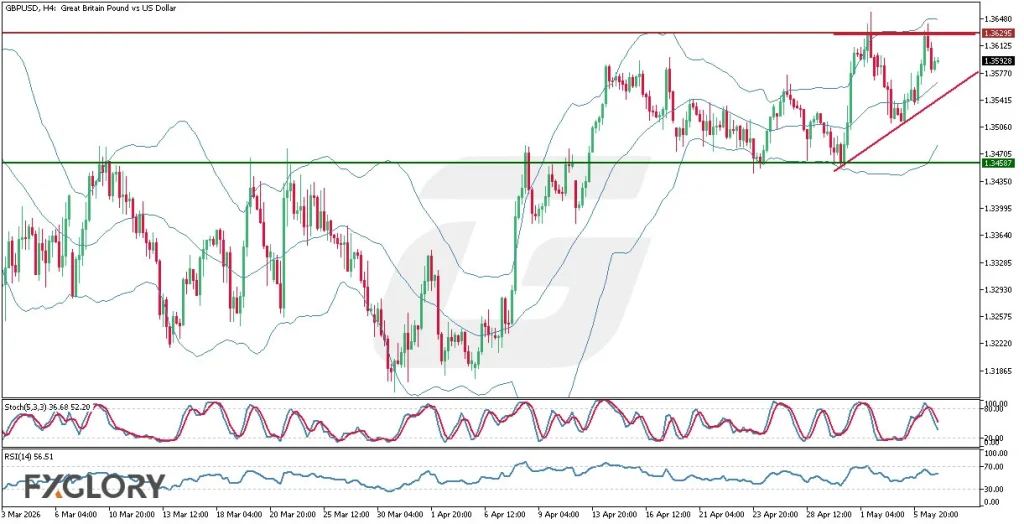
The GBPUSD H4 price action analysis shows that the pair has been moving in a broader ascending trend, consistently forming higher highs and higher lows over recent weeks. However, the candles are now facing strong resistance around the 1.36295 level, where several bullish attempts have failed to establish a confirmed breakout. At the same time, price continues to react positively from the 1.34587 support area, which has repeatedly acted as a strong buying zone. Between these support and resistance levels, the candles appear to be forming a bullish triangle pattern, suggesting that buying pressure is gradually increasing despite the current consolidation. If the pattern remains valid and buyers manage to break above resistance, the GBPUSD H4 forecast may favor continuation of the bullish trend.
Key Technical Indicators:
Bollinger Bands (30): After a previous expansion phase, the Bollinger Bands are now narrowing, indicating decreasing volatility and a possible breakout setup. The current consolidation near the upper half of the bands supports the ongoing bullish structure.
Stochastic (5,3,3): The Stochastic readings at 36.68 and 52.20 reflect recovering bullish momentum from lower levels. The indicator suggests that buyers are attempting to regain control after the recent pullback.
RSI (14): The RSI at 56.51 remains above the neutral 50 level, supporting a moderate bullish outlook. This indicates that bullish momentum still exists without entering overbought territory.
Support and Resistance:
Support: The major support level is located at 1.34587, which has repeatedly triggered bullish rebounds and maintained the upward structure.
Resistance: The key resistance stands at 1.36295, where recent candles have struggled to confirm a decisive bullish breakout.
Conclusion and Consideration:
The overall GBPUSD H4 chart daily analysis continues to favor a bullish outlook, although the pair is currently consolidating below an important resistance zone. The repeated defense of support at 1.34587 and the formation of a bullish triangle pattern suggest that buyers still maintain underlying market strength. Technical indicators such as RSI and Stochastic support the possibility of renewed bullish momentum, while the narrowing Bollinger Bands hint at a potential volatility expansion ahead. Fundamentally, speeches from BOE and Federal Reserve officials may become the key catalysts that determine the next directional move in the GBPUSD technical and fundamental analysis. A confirmed breakout above 1.36295 could open the door for further bullish continuation in the H4 timeframe.
Disclaimer: The analysis provided for GBP/USD is for informational purposes only and does not constitute investment advice. Traders are encouraged to perform their own analysis and research before making any trading decisions on GBPUSD. Market conditions can change quickly, so staying informed with the latest data is essential.