Time Zone: GMT +3
Time Frame: 4 Hours (H4)
Fundamental Analysis:
The EURUSD H4 technical and fundamental analysis for today is influenced by near-term Eurozone PMI updates, Sentix Investor Confidence, Eurogroup developments, and ECB-related commentary. For the Euro, stronger-than-expected Manufacturing PMI or investor confidence data could support EUR sentiment by signaling improving business conditions across the Eurozone. Comments from ECB officials may also create volatility if they provide clues about future monetary policy. For the USD, Factory Orders, Federal Reserve commentary, and credit-related updates remain important for assessing US economic strength and Fed policy expectations. Overall, today’s EURUSD daily analysis suggests that fundamental volatility may increase if European data or Fed remarks shift market expectations.
Price Action:
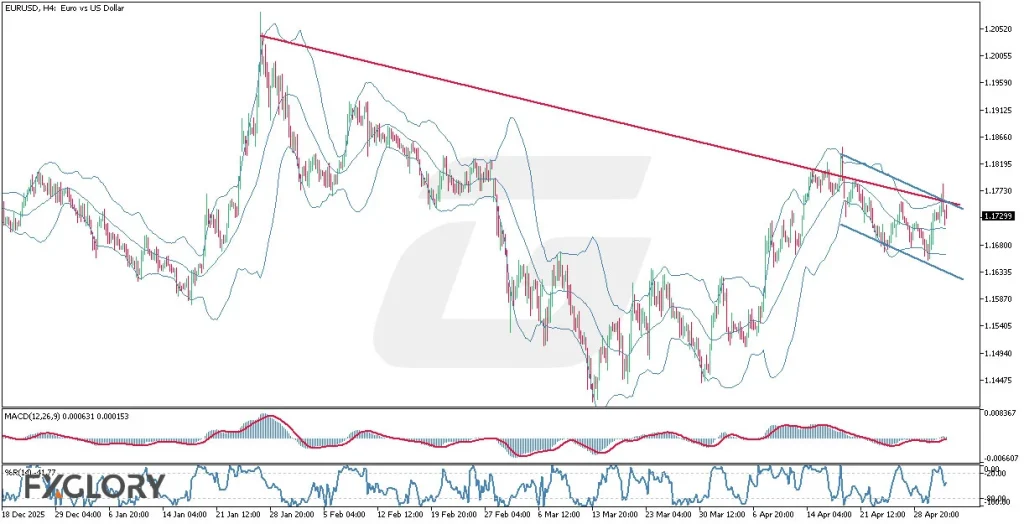
The EURUSD H4 price action analysis shows that the pair is still trading under a broader descending resistance line, while the recent candles are also moving inside a smaller bearish channel. Despite the previous bullish correction, the candles have failed to establish a clear breakout above the upper trendline, keeping sellers active near resistance. The latest candles show hesitation around the channel’s upper boundary, suggesting that buyers are attempting recovery but have not yet confirmed control. If the price remains below this resistance area, the market may continue moving toward the lower side of the bearish channel. In this EURUSD H4 forecast, a confirmed breakout above the descending lines would be needed to weaken the bearish outlook.
Key Technical Indicators:
Bollinger Bands (25): The Bollinger Bands have slightly expanded, showing rising volatility. Price remains vulnerable to another downside move if it fails to hold above the middle band.
MACD (12,26,9): The MACD values at 0.000631 and 0.000153 show that bullish momentum is still present. However, the momentum remains limited while price stays below the descending resistance structure.
Williams %R (14): The Williams %R at -41.77 reflects neutral market momentum. This shows that the pair is not overbought or oversold, supporting the current indecisive EURUSD price action.
Support and Resistance:
Support: The nearest support is aligned with the lower boundary of the bearish channel, which remains the next downside target if selling pressure continues.
Resistance: The key resistance is located near the upper boundary of the bearish channel, where recent candles have struggled to sustain bullish movement.
Conclusion and Consideration:
The EURUSD H4 chart daily analysis continues to show bearish pressure, even though the pair previously attempted a bullish correction. Current EURUSD price action remains contained inside a descending channel, and the upper channel boundary is acting as an important resistance zone. Technical indicators show some short-term bullish attempts, but they are not strong enough yet to invalidate the bearish structure. Fundamentally, Eurozone PMI-related updates, investor sentiment, ECB commentary, and US data may influence volatility during today’s session. A clear breakout above the channel would weaken the bearish outlook, while rejection from resistance may support continuation toward the lower channel boundary.
Disclaimer: The analysis provided for EUR/USD is for informational purposes only and does not constitute investment advice. Traders are encouraged to perform their own analysis and research before making any trading decisions on EURCAD. Market conditions can change quickly, so staying informed with the latest data is essential.