Time Zone: GMT +3
Time Frame: 4 Hours (H4)
Fundamental Analysis:
The BTC/USD pair reflects the price of Bitcoin against the US Dollar, and this BTCUSD H4 technical and fundamental chart daily analysis is currently influenced by mixed macro and geopolitical drivers. Stronger University of Michigan sentiment and inflation expectations data would usually support the USD, which may limit Bitcoin vs US Dollar upside in the short term, while rising tensions around the Strait of Hormuz and Tehran may increase market uncertainty and support Bitcoin demand as an alternative asset. Overall, the fundamental backdrop for this BTC/USD price action H4 outlook remains mixed, with USD strength on one side and geopolitical risk-driven volatility on the other.
Price Action:
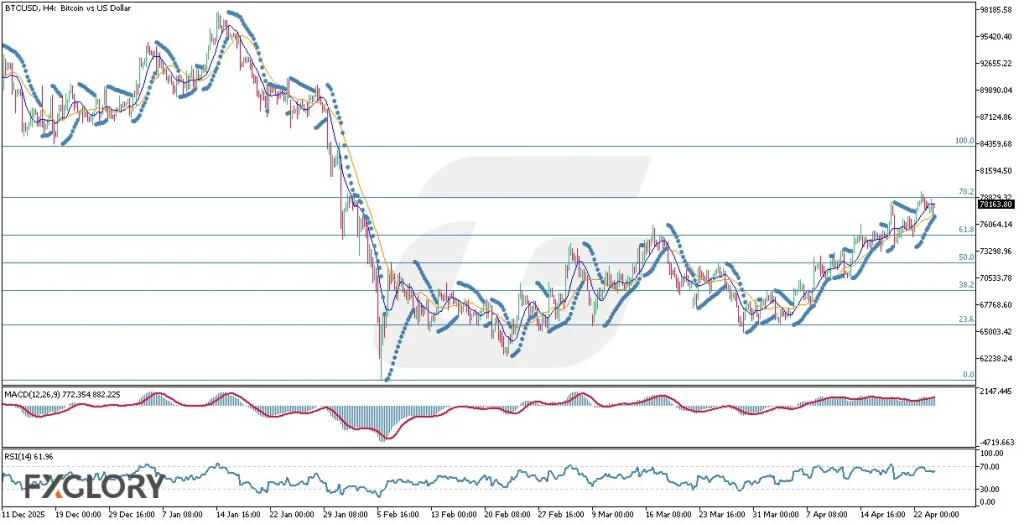
The BTC/USD H4 chart daily analysis shows a gradual bullish recovery after the strong January decline and the February low near 62,200. Since then, Bitcoin has corrected the previous fall and moved back toward the 78,000 area, but price is still trading below a key resistance zone around 79,000. This Bitcoin vs US Dollar price action analysis suggests a controlled upward move inside a broad range, with buyers improving structure but still needing a breakout confirmation above resistance.
Key Technical Indicators:
Parabolic SAR: The Parabolic SAR dots are below the candles, which keeps the short-term BTC/USD H4 trend bullish. This shows that buyers still control momentum unless the dots flip above price.
Moving Averages (MA 9 and MA 21): The MA 9 is above the MA 21, confirming a positive short-term trend in this BTCUSD H4 forecast. As long as this alignment holds, the market keeps a bullish bias.
MACD (12,26,9): The MACD remains in positive territory, supporting the ongoing recovery in Bitcoin vs US Dollar H4 technical analysis. It shows bullish momentum, although not yet a very strong breakout phase.
RSI (14): The RSI is at 61.96, which confirms positive momentum while staying below overbought territory. This suggests BTC/USD still has room to rise before becoming overstretched.
Support and Resistance:
Support: Immediate support is located around 76,064, followed by 73,299; below that, 70,534 remains an important downside level.
Resistance: The nearest resistance is around 78,929 to 79,000, and a break above this zone could open the way toward 84,359.
Conclusion and Consideration:
This BTCUSD H4 technical and fundamental analysis shows that Bitcoin is recovering steadily and trading with a bullish short-term structure, but it is now testing a critical resistance zone. The indicators support the current upward bias, though price still needs a confirmed breakout above 79,000 to strengthen the bullish continuation scenario. Traders should also watch USD-related data and geopolitical headlines, as both can quickly affect Bitcoin volatility and short-term direction.
Disclaimer: The analysis provided for BTC/USD is for informational purposes only and does not constitute investment advice. Traders are encouraged to perform their own analysis and research before making any trading decisions on BTCUSD. Market conditions can change quickly, so staying informed with the latest data is essential.