Time Zone: GMT +3
Time Frame: 4 Hours (H4)
Fundamental Analysis:
The XAUUSD H4 technical analysis today is heavily linked to the USD side, with several US events capable of driving volatility in the gold market. Traders will watch comments from US President Donald Trump on tax policies, IMF-related developments, and speeches from Fed officials Mary Daly, Thomas Barkin, and Christopher Waller for signals on inflation, interest rates, and the broader monetary policy outlook. A more hawkish tone from Fed speakers could strengthen the US Dollar and pressure gold prices, while softer remarks may support safe-haven demand and help Gold push higher. This makes today’s Gold fundamental analysis especially important for short-term traders following USD news today and XAU/USD H4 price action.
Price Action:
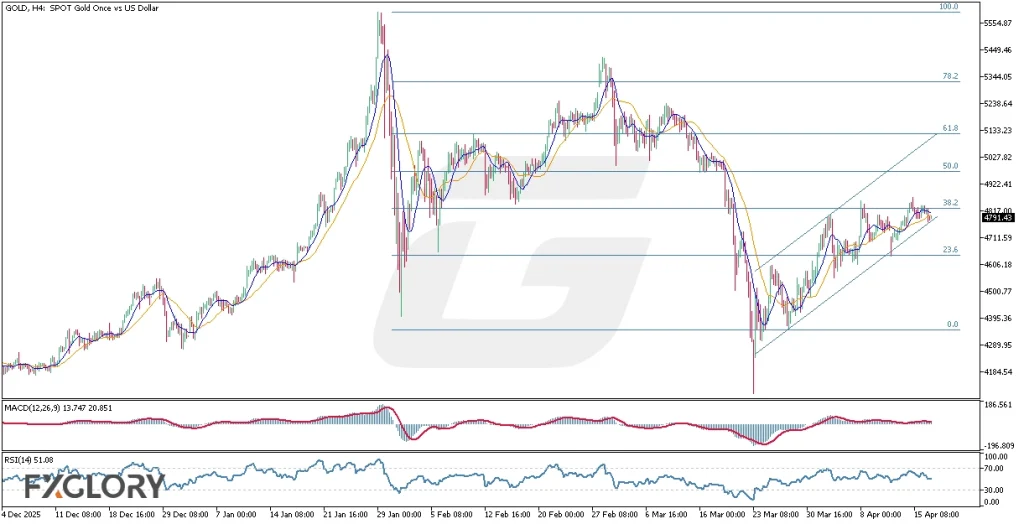
The Gold price action on the H4 chart shows that XAUUSD remains inside an ascending corrective channel after the strong drop seen in late March. However, the recovery has been capped several times at the 38.2% Fibonacci retracement near 4817.00, showing that buyers are still struggling to confirm a stronger bullish breakout. The latest candles are trading near the lower side of the rising channel, which creates a key decision area for the next move. In this XAU-USD H4 chart analysis, price now needs to break above 4817.00 to continue higher, or break below the lower channel line to confirm a deeper pullback.
Key Technical Indicators:
Moving Averages (MA 9 and MA 21): The MA 9 is still above the MA 21, so the short-term structure remains slightly bullish. However, the MA 9 is turning downward and both averages are getting close to each other, which suggests weakening momentum and a possible pullback if a bearish crossover forms.
MACD (12,26,9): The MACD values are at 13.747 and 20.851, showing that momentum is still positive but not strong. The indicator reflects slowing bullish pressure, so traders should watch for a possible bearish crossover if price remains below resistance.
RSI (14): The RSI is at 51.08, which is close to the neutral zone and shows a balanced market without overbought or oversold conditions. This supports the view that Gold is waiting for a breakout from the current H4 range.
Support and Resistance:
Support: Immediate support is located around 4711.59, with stronger support at 4606.18, which also matches the 23.6% Fibonacci retracement area.
Resistance: Immediate resistance is located at 4817.00, the 38.2% Fibonacci retracement, followed by 4922.41 as the next bullish target.
Conclusion and Consideration:
The XAU vs. USD H4 technical and fundamental analysis shows that gold is trading at a critical area between channel support and Fibonacci resistance. The price action remains corrective-bullish for now, but the repeated rejection from 4817.00, the weakening slope of the MA 9, and the soft momentum shown by MACD suggest caution. The RSI near 51 also confirms that the market is waiting for fresh direction. With important USD news today and multiple Fed speakers on the calendar, Gold price action could become more volatile, so traders should watch closely for either a breakout above resistance or a breakdown below channel support.
Disclaimer: The analysis provided for GOLD/USD is for informational purposes only and does not constitute investment advice. Traders are encouraged to perform their own analysis and research before making any trading decisions on GOLDUSD. Market conditions can change quickly, so staying informed with the latest data is essential.