Time Zone: GMT +2
Time Frame: 4 Hours (H4)
Fundamental Analysis:
The USDCAD H4 technical and fundamental analysis is influenced by several important economic indicators from both Canada and the United States. For the Canadian Dollar, traders monitor International Transactions in Securities and upcoming Bank of Canada (BOC) interest rate decisions and statements, as hawkish monetary policy signals typically strengthen the CAD. On the US side, inflation indicators such as the Producer Price Index (PPI) and Core PPI, along with Factory Orders and Treasury International Capital (TIC) data, may impact USD sentiment. Additionally, EIA crude oil inventories remain important because oil price movements often influence the Canadian Dollar due to Canada’s strong energy sector.
Price Action:
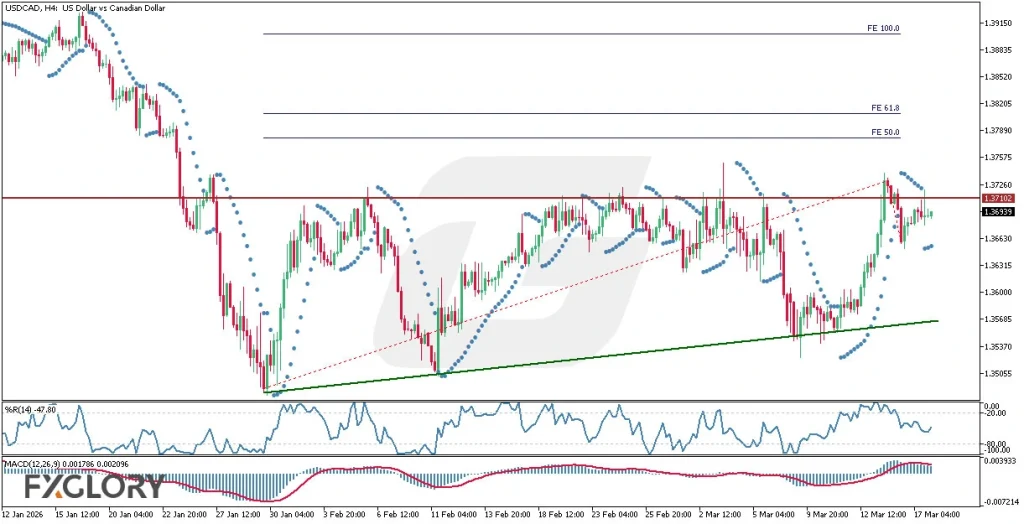
The USDCAD H4 price action analysis shows that after a sharp bearish move, the market has started forming slightly higher lows, indicating a gradual shift toward bullish pressure. However, the pair is facing strong resistance near 1.37102, which has repeatedly rejected upward attempts. Despite the latest breakout failure, the price is once again testing this level, suggesting persistent buying interest. If the candles manage to break and close above this resistance, the Fibonacci Expansion levels 50.0 and 61.8 may become the next potential bullish targets.
Key Technical Indicators:
Parabolic SAR: The Parabolic SAR dots have recently appeared below the candles, signaling a potential shift toward bullish momentum. This positioning typically indicates that buyers may be gaining control of the short-term trend. If the indicator continues to stay below the price, it could support further upward movement in the USDCAD H4 technical outlook.
Williams %R (14): The Williams %R indicator is currently at -47.80, placing it in the middle of the momentum range. This suggests the market is neither overbought nor oversold and still has room to move higher. The indicator reflects balanced momentum but slightly favors bullish continuation if buying pressure increases.
MACD (12,26,9): The MACD indicator values of 0.001786 and 0.002096 show mild positive momentum building in the market. The histogram remains slightly positive, indicating that bullish pressure is gradually increasing. A stronger divergence between the MACD and signal lines could confirm a potential upward breakout.
Support and Resistance:
Support: The nearest support level is around 1.36000, aligned with the ascending trendline and recent consolidation area.
Resistance: The main resistance level is 1.37102, which currently acts as the key barrier for further bullish continuation.
Conclusion and Consideration:
The USDCAD H4 technical analysis and price action forecast suggests a cautiously bullish outlook as the pair forms higher lows while testing a key resistance zone. Technical indicators such as Parabolic SAR, Williams %R, and MACD point to gradually strengthening bullish momentum. A confirmed breakout above 1.37102 could lead the pair toward the Fibonacci expansion levels of 50.0 and 61.8, but traders should remain attentive to upcoming economic releases and central bank signals that could increase volatility in the USDCAD forex market.
Disclaimer: The analysis provided for USD/CAD is for informational purposes only and does not constitute investment advice. Traders are encouraged to perform their own analysis and research before making any trading decisions on USDCAD. Market conditions can change quickly, so staying informed with the latest data is essential.