Time Zone: GMT +2
Time Frame: 4 Hours (H4)
Fundamental Analysis:
In today’s technical and fundamental chart daily analysis for XAU/USD H4, Gold (XAU) is positioned at the center of heightened USD-driven volatility. Multiple Federal Reserve officials, including FOMC members, are scheduled to speak at policy conferences, and any hawkish tone regarding interest rates could strengthen the US Dollar (USD), potentially pressuring Gold prices. Additionally, high-frequency labor data from ADP (NER Pulse), housing indicators such as the FHFA House Price Index and S&P Case-Shiller, along with The Conference Board Consumer Confidence and Richmond Fed Manufacturing Index, may significantly impact USD sentiment. Stronger-than-expected US economic data would typically support the Dollar and weigh on XAU/USD, while dovish commentary or weaker data could fuel further upside in Gold. Therefore, today’s fundamental outlook for XAU/USD H4 suggests elevated volatility driven by monetary policy expectations and macroeconomic releases.
Price Action:
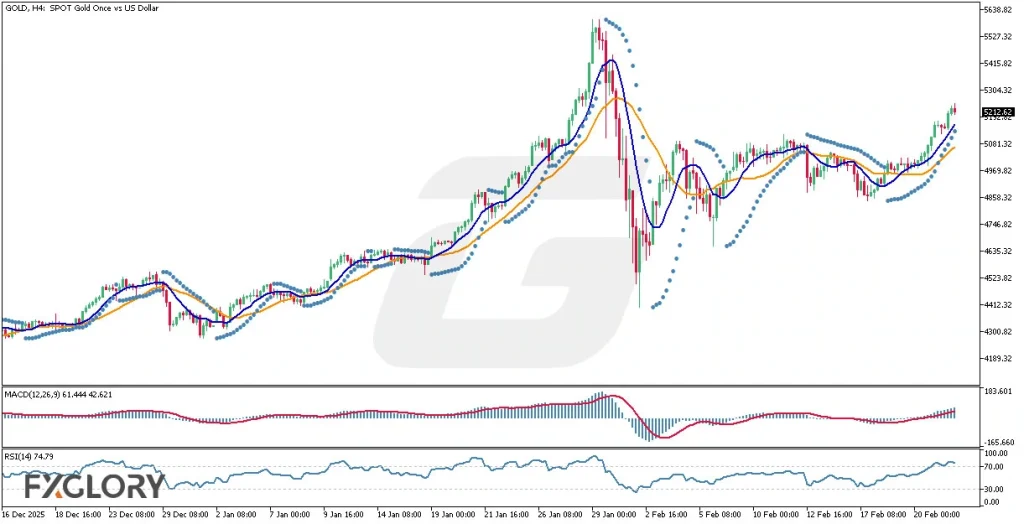
From a price action perspective in this XAU/USD H4 technical analysis, Gold is clearly moving upward after recovering sharply from the late-January sell-off. The price has formed a sequence of higher highs and higher lows, confirming a renewed bullish structure on the H4 timeframe. Recent candles show strong bullish momentum pushing toward the 5212.62 area, indicating sustained buying interest. The breakout above previous consolidation zones signals that bulls are regaining control, aligning with the broader bullish price action narrative in this Gold H4 chart daily analysis.
Key Technical Indicators:
Parabolic SAR: The Parabolic SAR dots are currently placed below the candles, confirming a bullish trend continuation on the H4 chart. This positioning indicates that upward momentum remains intact and that buyers are dominating the market structure. As long as the SAR dots remain below price, the technical bias for GOLD H4 remains positive. A flip above the candles would be the first early warning of a potential corrective move.
Moving Averages (MA 9 & MA 21): The short-term MA 9 (blue) has crossed above the longer-term MA 21 (orange), and both moving averages are sloping upward. This bullish crossover is a classic trend-confirmation signal in technical chart analysis for XAU/USD H4. The widening gap between the two MAs suggests strengthening upside momentum. As long as price remains above both moving averages, the bullish structure remains technically valid.
MACD (12,26,9): The MACD (12,26,9) is showing strong bullish momentum, with values around 61.444 and 42.621, and the histogram expanding on the positive side. The MACD line remains above the signal line, confirming upward momentum in this Gold H4 technical analysis. The increasing histogram bars reflect strengthening buying pressure. However, traders should monitor for any bearish crossover that could indicate momentum exhaustion.
RSI (14): The RSI (14) is currently at 74.79, indicating overbought conditions on the H4 timeframe. While this reflects strong bullish momentum, it also suggests that the price may be vulnerable to short-term pullbacks or consolidation. In trending markets, RSI can remain overbought for extended periods, especially during strong bullish runs. Therefore, the RSI supports the uptrend but calls for cautious risk management.
Support and Resistance:
Support: Immediate support is located at 5081.32, aligning with a recent consolidation zone and positioned near the rising MA 9 and MA 21 cluster, reinforcing its technical significance in this GOLD/USD H4 technical analysis.
Resistance: The nearest resistance level stands at 5212.62, representing the current breakout zone and recent H4 highs, acting as a key barrier for further bullish continuation in the Gold H4 price action outlook.
Conclusion and Consideration:
In this comprehensive technical and fundamental chart daily analysis for GOLD/USD H4, Gold maintains a strong bullish bias supported by upward price action, a bullish MA crossover, positive MACD momentum, and Parabolic SAR confirmation. However, the RSI in overbought territory signals potential short-term consolidation before further upside continuation. With numerous Federal Reserve speakers and key US economic releases scheduled today, volatility in the USD is expected to remain elevated, directly impacting XAU/USD price dynamics. Traders should closely monitor fundamental catalysts alongside technical levels for confirmation of continuation or reversal signals in this Gold H4 price action setup.
Disclaimer: The analysis provided for GOLD/USD is for informational purposes only and does not constitute investment advice. Traders are encouraged to perform their own analysis and research before making any trading decisions on GOLDUSD. Market conditions can change quickly, so staying informed with the latest data is essential.