Time Zone: GMT +2
Time Frame: 4 Hours (H4)
Fundamental Analysis:
The AUD/USD currency pair dynamics are influenced significantly by upcoming key economic releases today. From the US side, investors anticipate crucial data from the S&P Global Manufacturing PMI and the ISM Manufacturing PMI reports. Positive figures above the forecast can strengthen the USD, suggesting economic expansion and potentially pressuring the AUDUSD downward. Additionally, remarks from Federal Reserve Bank of Atlanta President Raphael Bostic regarding monetary policy could further impact market sentiment and USD strength. On Australia’s front, upcoming data such as the Melbourne Institute Consumer Price Index and the ANZ Job Advertisements, along with Reserve Bank of Australia’s Commodity Prices, could affect AUD volatility, making it essential for traders to closely monitor these economic indicators.
Price Action:
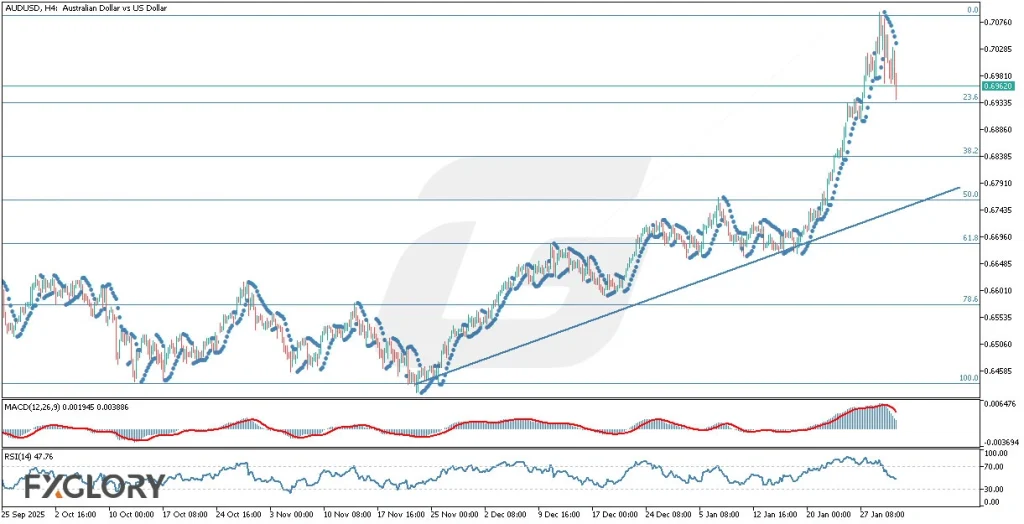
Analyzing the AUDUSD pair on the H4 timeframe, the price has maintained a bullish momentum for a significant duration. However, the recent upward acceleration was interrupted by strong bearish pressure, indicating a potential reversal or deep correction. Currently, the price approaches the 23.6 Fibonacci retracement level, suggesting that short-term corrections could form around this level. However, given the prevailing bearish momentum, price action suggests a possible continuation downward beyond this retracement point.
Key Technical Indicators:
Parabolic SAR: The Parabolic SAR dots positioned above the candles indicate a bearish sentiment, signaling that the market trend has shifted from bullish to bearish in the short term.
MACD (12,26,9): The MACD values at 0.001945 and 0.003886 display diminishing bullish momentum, as evidenced by the declining histogram. A potential bearish crossover might occur soon, reinforcing bearish momentum.
RSI (14): The RSI currently stands at 47.76, below the neutral 50 level. This indicates a neutral to bearish bias and confirms there is additional room for downward price movement before reaching oversold conditions.
Support and Resistance:
Support: The immediate support for AUDUSD is found at the Fibonacci retracement level of 23.6 (around 0.6930), which is expected to offer temporary buying interest.
Resistance: Immediate resistance lies at recent highs around 0.7075, acting as a critical barrier that bulls need to overcome to re-establish upward momentum.
Conclusion and Consideration:
The AUDUSD H4 chart analysis suggests increasing bearish pressure, confirmed by Parabolic SAR, MACD, and RSI indicators, signaling a likely continued decline in the short term. Traders should remain cautious and attentive to today’s critical economic data releases from both the US and Australia, as they could significantly influence the AUDUSD volatility and direction. Monitoring these key support and resistance levels is advised to navigate the current bearish phase effectively.
Disclaimer: The analysis provided for AUD/USD is for informational purposes only and does not constitute investment advice. Traders are encouraged to perform their own analysis and research before making any trading decisions on AUDUSD. Market conditions can change quickly, so staying informed with the latest data is essential.