Time Zone: GMT +3
Time Frame: 4 Hours (H4)
Fundamental Analysis:
The USD/JPY currency pair is set for significant volatility today as major economic events and speeches by central bank officials are scheduled. BOJ Governor Kazuo Ueda and Federal Reserve Chair Jerome Powell are due to participate in policy discussions at the ECB Forum, providing crucial insights into future monetary policies and potentially triggering sharp market movements. Furthermore, key manufacturing PMI data releases for both the US and Japan will likely influence market sentiment and currency strength, impacting the USDJPY price significantly.
Price Action:
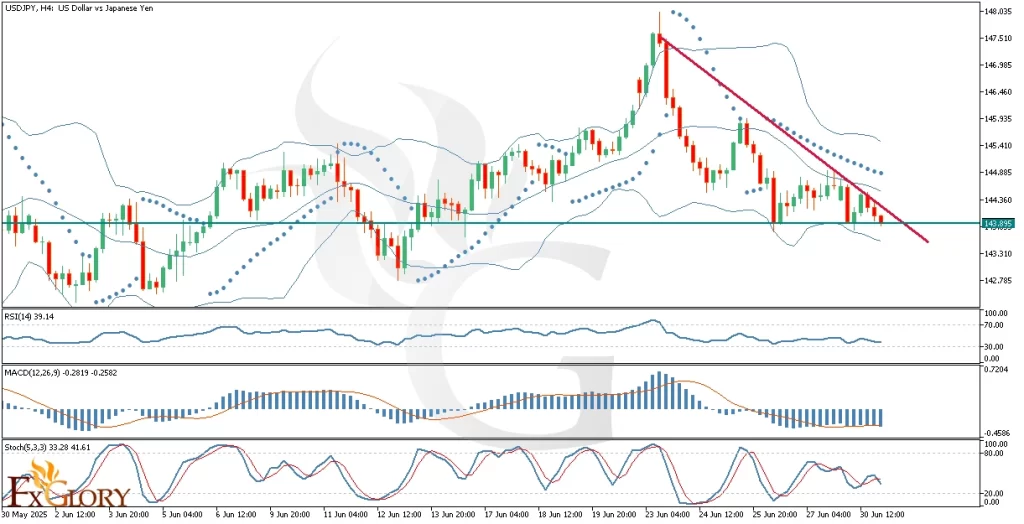
The USD JPY analysis on the H4 timeframe currently reveals a bearish sentiment. Price action has maintained a clear downtrend, touching crucial support at 143.895. The recent three red candles suggest ongoing bearish momentum, though the pair is now at a pivotal level. If support holds firm, price action would need to breach the downward trendline resistance to confirm a bullish reversal. Failure to hold this support may drive the pair towards the lower Bollinger Band.
Key Technical Indicators:
Parabolic SAR: The Parabolic SAR dots remain positioned above the candles, strongly confirming the ongoing bearish momentum in the USD-JPY. Traders should monitor closely for any shift of SAR dots below candles, signaling a potential reversal.
RSI (Relative Strength Index): The RSI indicator currently sits at 39.14, indicating a bearish momentum that has not yet reached oversold conditions. This leaves room for further declines before potential bullish pressure emerges.
MACD (Moving Average Convergence Divergence): The MACD histogram is negative and has been consistently showing bearish momentum. The MACD line remains below the signal line, affirming continued selling pressure and cautioning against immediate long positions without clear reversal signals.
Stochastic Oscillator: The Stochastic oscillator reading is at 33.28, showing a downward trajectory which indicates continued bearish momentum. It has not yet reached oversold territory, suggesting potential for further downside in the near term.
Bollinger Bands: Price is currently hovering near the lower Bollinger Band, which typically serves as dynamic support. The bands are slightly widening, suggesting potential for increased volatility. Should the price rebound from the current level, the mid-band becomes the primary target, whereas a break below could accelerate declines.
Support and Resistance:
Support: Immediate support is firmly established at 143.895, aligned with recent price lows.
Resistance: The nearest significant resistance is at the descending trendline around the 144.500 level, followed by the Bollinger Band middle line near 144.800.
Conclusion and Consideration:
The USDJPY pair’s H4 chart reflects a bearish trend, supported by technical indicators such as MACD, RSI, Parabolic SAR, and Stochastic Oscillator. Fundamental events, particularly speeches by BOJ Governor Kazuo Ueda and Fed Chair Jerome Powell, and manufacturing PMI releases, can significantly influence price direction today. Traders should watch closely for a confirmed break or rebound from the support line at 143.895 to guide trading decisions. Due to expected high volatility, maintaining strict risk management strategies is strongly recommended.
Disclaimer: The analysis provided for USD/JPY is for informational purposes only and does not constitute investment advice. Traders are encouraged to perform their own analysis and research before making any trading decisions on USDJPY. Market conditions can change quickly, so staying informed with the latest data is essential.