Current weekly forecast: This outlook covers 17–24 October 2026 and remains valid until 24 October 2026, unless its stated invalidation condition is triggered earlier.
Daily check — 20 October 2026: The latest completed D1 close was 0.82663 on 19 October 2026. It remains between the formal invalidation levels 0.82052 and 0.83662. The authored weekly thesis remains valid.
In brief
USD/CHF has a neutral weekly outlook as bullish D1 structure is offset by bearish H4 pressure and neutral momentum.
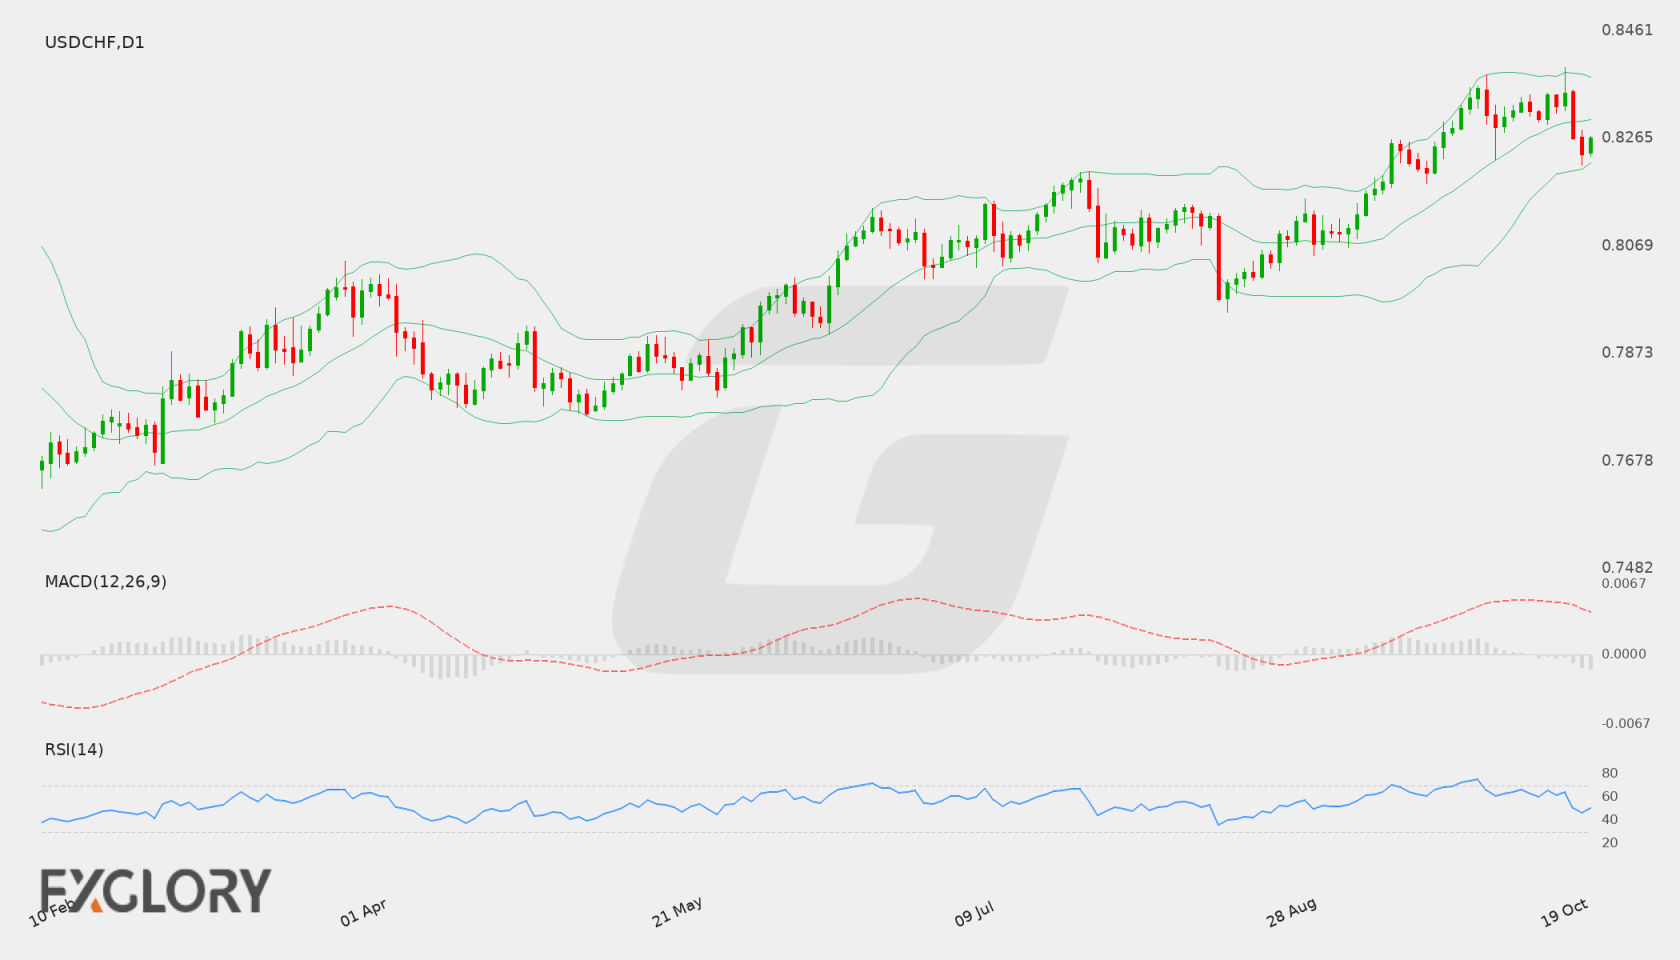
The weekly picture is balanced rather than directionless: the D1 trend state is bullish, the EMA50 and SMA200 slopes are rising, and the reference close at 0.82658 remains between the primary support at 0.82262 and primary resistance at 0.82952. That constructive structure is tempered by a mixed D1 close sequence and momentum classified as neutral.
H4 introduces the main tactical counterweight, with a bearish state, RSI at 35.74 and MACD below its signal line. A move through the supplied H4 resistance at 0.82585 could reduce immediate downside pressure, while weakness toward H4 support at 0.82276 would keep the D1 structure under scrutiny. Stable volatility suggests level tests may develop without volatility itself providing direction.
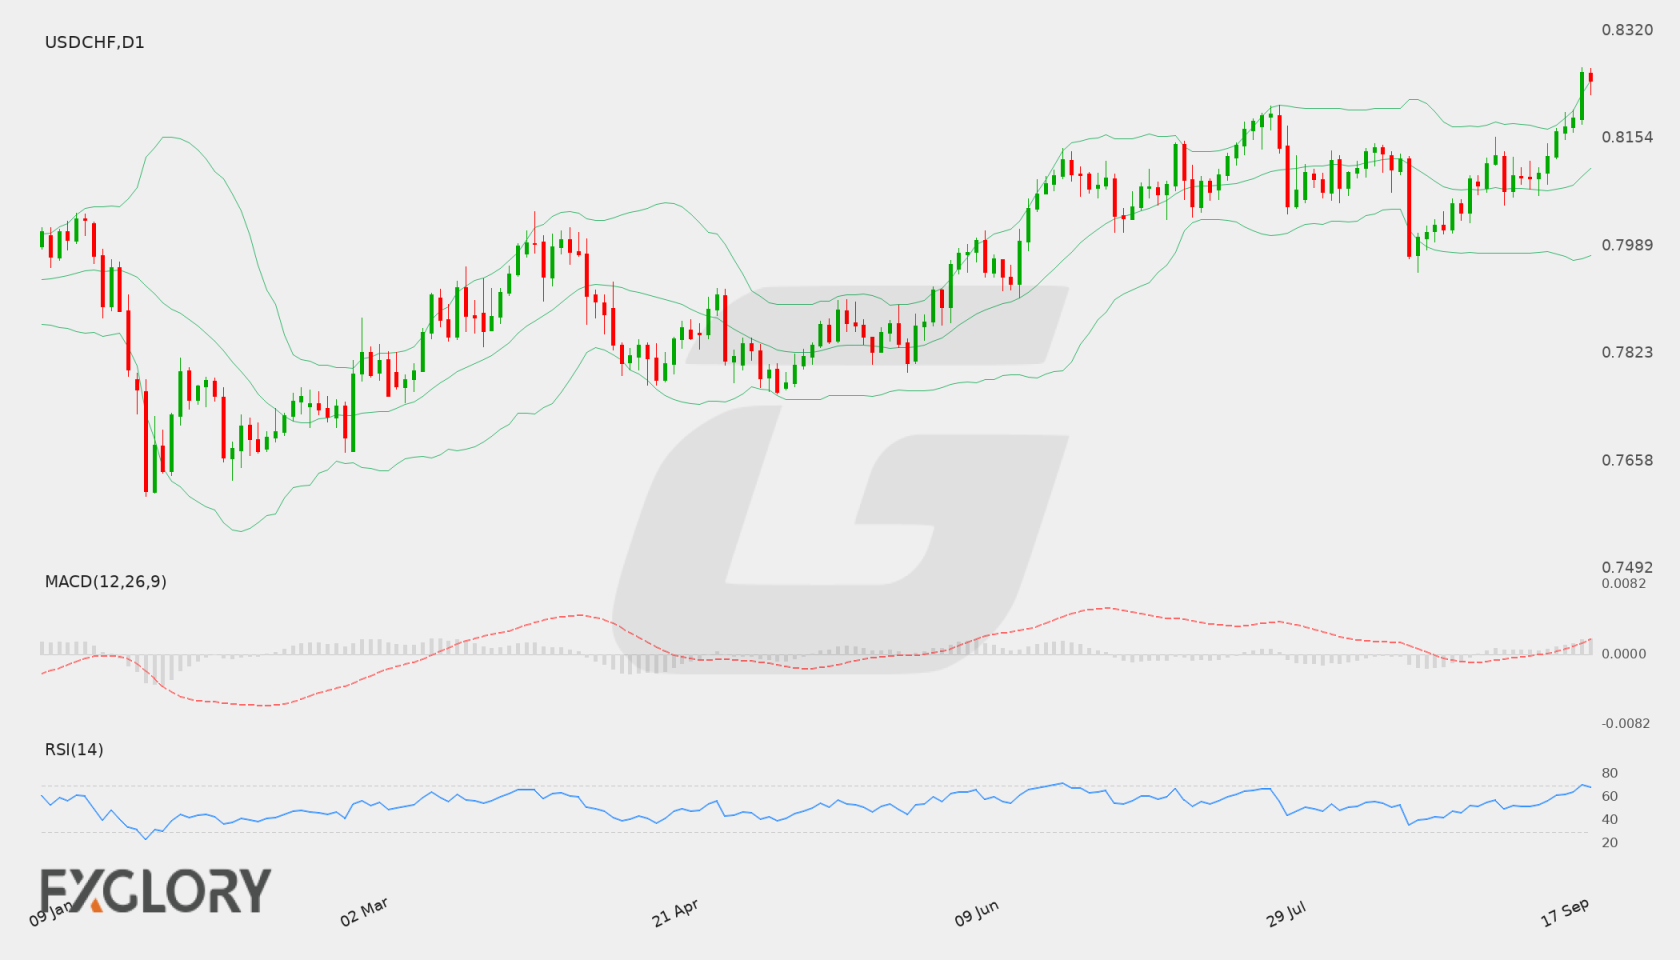
USD/CHF D1 technical-analysis context for the weekly forecast. Chart data captured 20 October 2026.
USD/CHF has a neutral weekly outlook as bullish D1 structure is offset by bearish H4 pressure and mixed momentum.
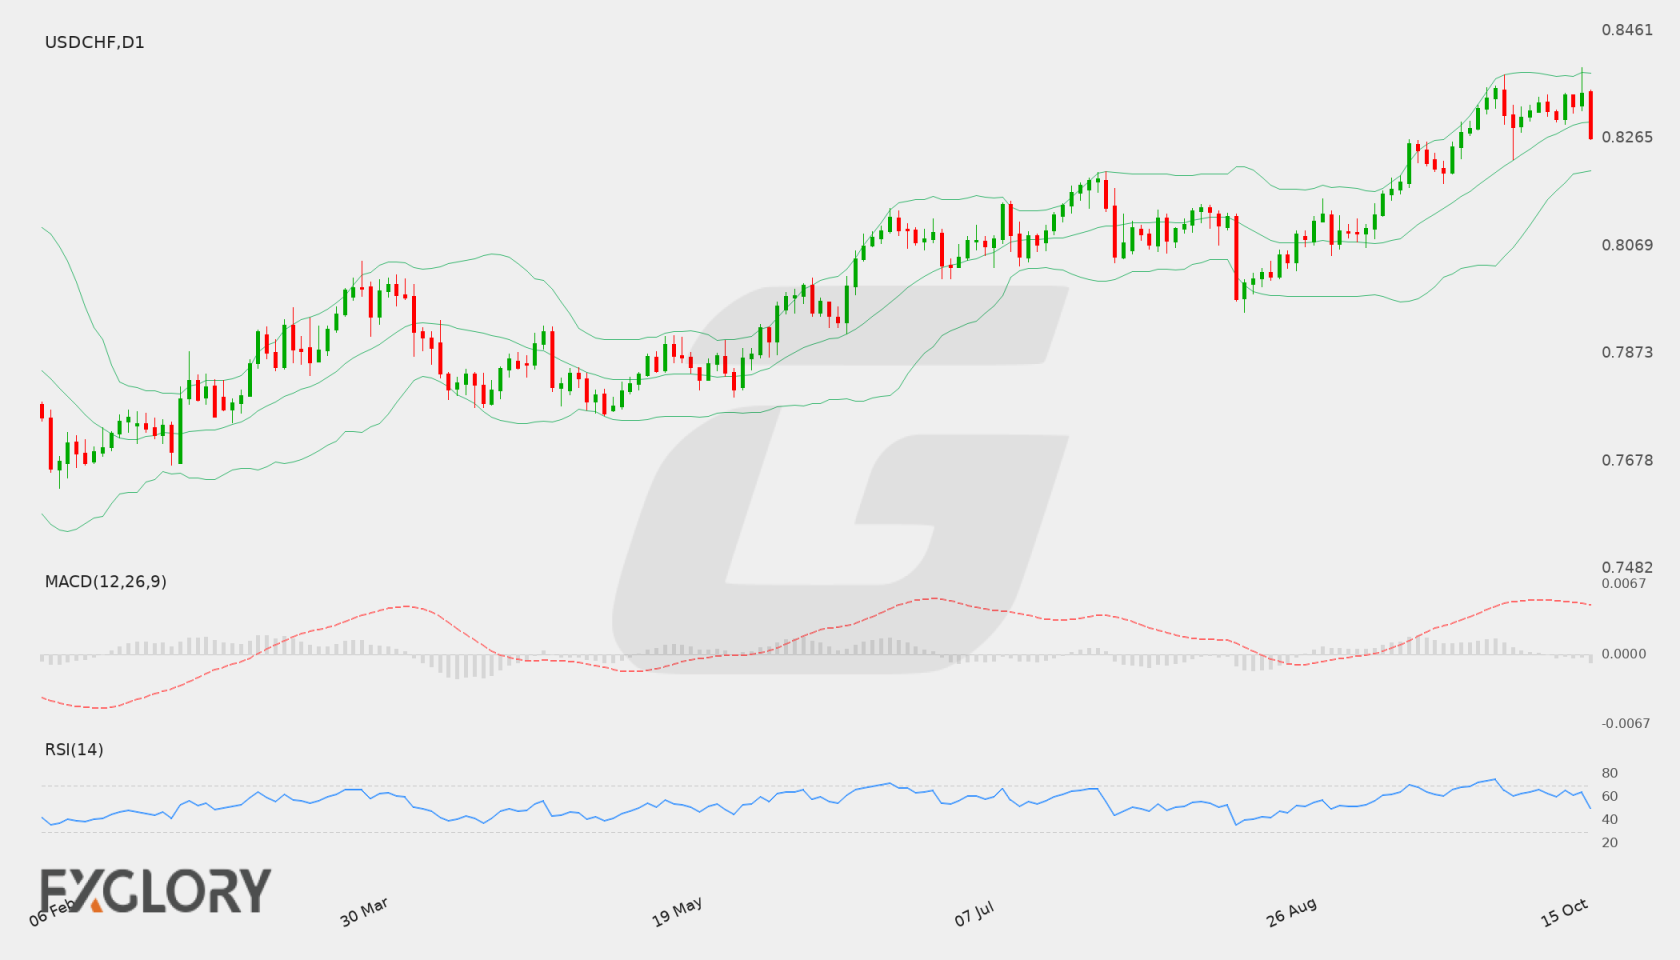
The weekly picture is balanced rather than directionless: the D1 trend is bullish, the EMA50 slope is rising and the SMA200 slope is rising, while the last D1 close of 0.83156 remains above the D1 EMA20 at 0.82641 and EMA50 at 0.8185. That structure supports the broader upside case, but the mixed D1 close sequence and mixed momentum argue against treating continuation as established.
Tactical conditions are less supportive. The H4 state is bearish, with the H4 close at 0.83009 below the H4 EMA20 at 0.83173 and EMA50 at 0.83102, while H4 MACD is below its signal. This creates room for consolidation or a corrective test of 0.82669 and 0.82262 before the D1 structure is reassessed.
USD/CHF D1 technical-analysis context for the weekly forecast. Chart data captured 16 October 2026.
The USD/CHF currency pair remains responsive to key macroeconomic developments from the United States, alongside shifts in broader risk appetite. Upcoming US indicators—including the ISM Services PMI, the release of the FOMC Meeting Minutes, weekly Unemployment Claims, and preliminary University of Michigan Consumer Sentiment and Inflation Expectations—may influence policy expectations for the Federal Reserve and drive dollar volatility.
Price Action:
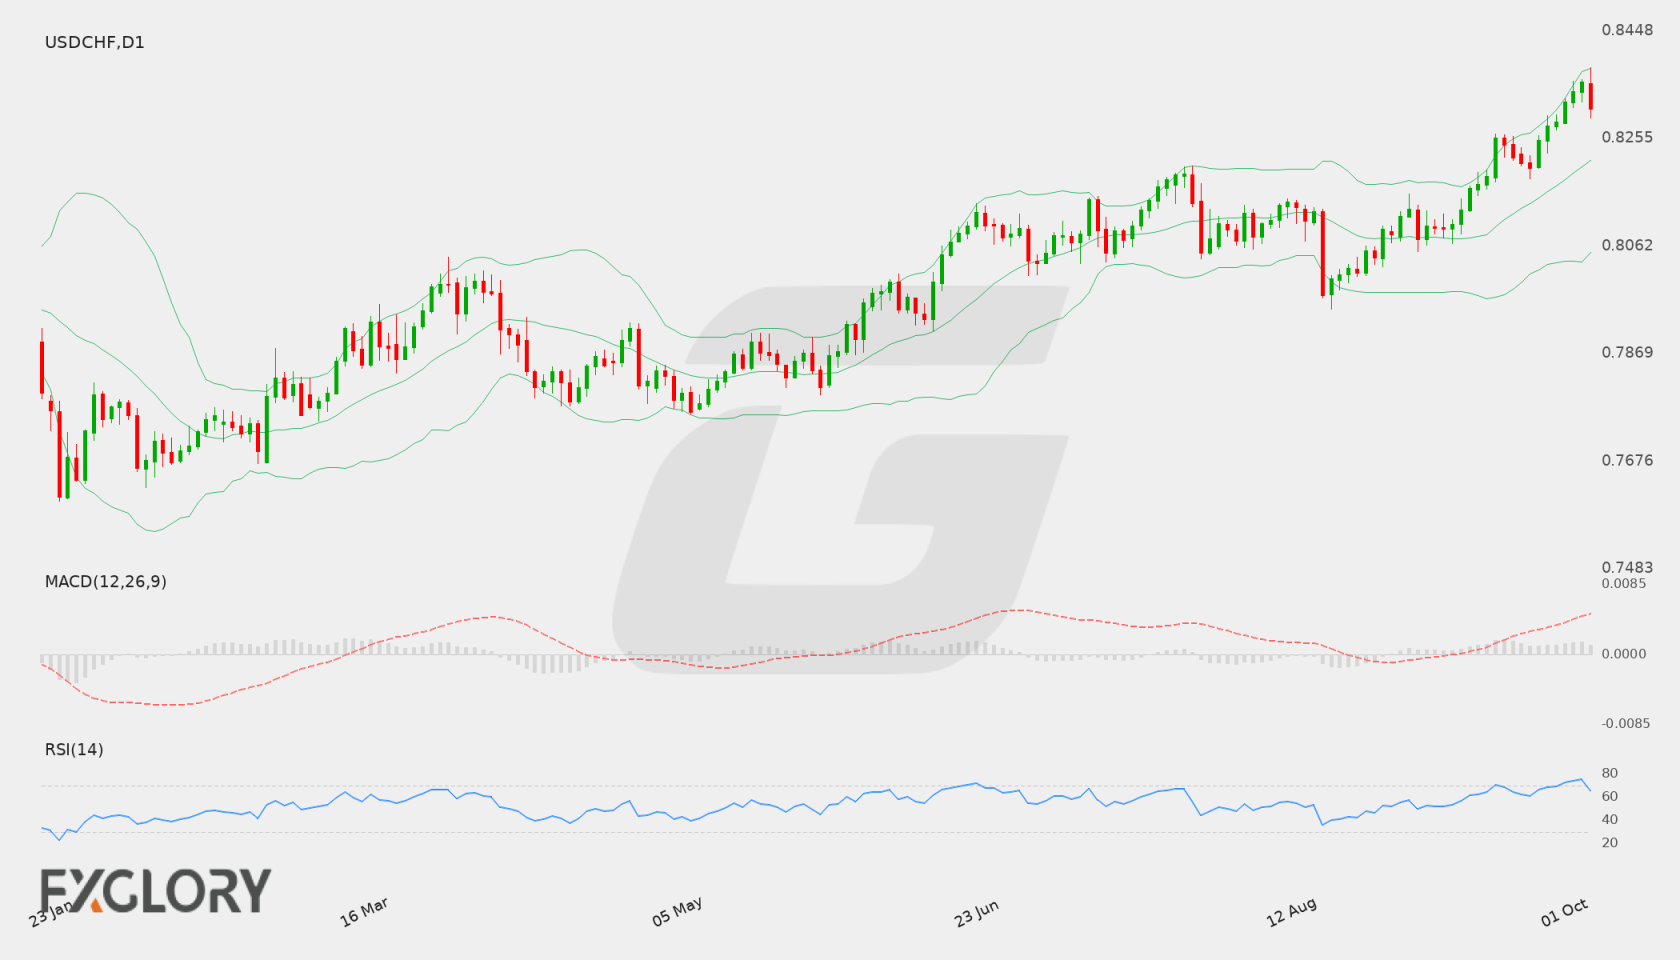
On the daily (D1) timeframe, USD/CHF has displayed an upward trajectory from the 0.8000 region toward recent highs, touching a peak of 0.83810 before pulling back to a close of 0.83089. While recent candles illustrate persistent buying interest, the rejection near 0.83810 highlights short-term selling pressure at higher levels.
Key Technical Indicators:
Bollinger Bands: The Bollinger Bands on the daily chart reflect widening volatility, with the middle band positioned at 0.82150, the upper band at 0.83804, and the lower band at 0.80495. USD/CHF is trading well above the middle band and near the upper envelope, underscoring ongoing upward pressure while approaching outer band boundaries.
RSI: The 14-day Relative Strength Index (RSI) stands at 65.29. This level reflects strong bullish momentum without having crossed into overbought territory above 70, leaving room for further price movement in either direction.
MACD: The daily MACD indicator holds a positive reading of 0.005982. This positive posture indicates that bullish momentum has retained control over recent sessions, though traders will monitor for any loss of upward momentum near resistance.
Support and Resistance:
Key technical levels defined on the daily chart place primary resistance at 0.83810, which capped recent upward attempts. On the downside, key support is established at 0.79483, marking a crucial defensive threshold should a deeper retracement develop.
News to Watch for USDCHF This Week:
ISM Services PMI: Provides insight into the health of the US services sector and can impact interest rate expectations.
FOMC Meeting Minutes: Delivers detailed context on Federal Reserve deliberations and future monetary policy leanings.
Unemployment Claims: Offers a weekly reading on the US labor market that influences near-term US dollar sentiment.
Prelim UoM Inflation Expectations: Measures consumer inflation expectations, which factor into central bank policy considerations.
Prelim UoM Consumer Sentiment: Reflects US consumer confidence and prospective household spending trends.
Weekly Outlook and Consideration:
USD/CHF enters the week maintaining a bullish posture on the daily timeframe, supported by an RSI of 65.29 and a positive MACD of 0.005982. The pair trades above its 20-day middle Bollinger Band of 0.82150, with the recent close at 0.83089. Price action is currently framed between support at 0.79483 and resistance at 0.83810. With several high-tier US data releases on the schedule, momentum will depend on whether buyers can overcome the 0.83810 resistance level or if a consolidation back toward intermediate levels takes hold.
Disclaimer: The analysis provided for USD/CHF is for informational purposes only and does not constitute investment advice. Traders are encouraged to perform their own analysis and research before making any trading decisions. Market conditions can change quickly, so staying informed with the latest data is essential.
The USD/CHF currency pair displays solid bullish sentiment heading into the new trading week, influenced by prevailing US dollar strength against the Swiss franc. Traders will closely monitor forthcoming US manufacturing releases to gauge the resilience of the US economy and its impact on the pair’s trajectory.
Price Action:
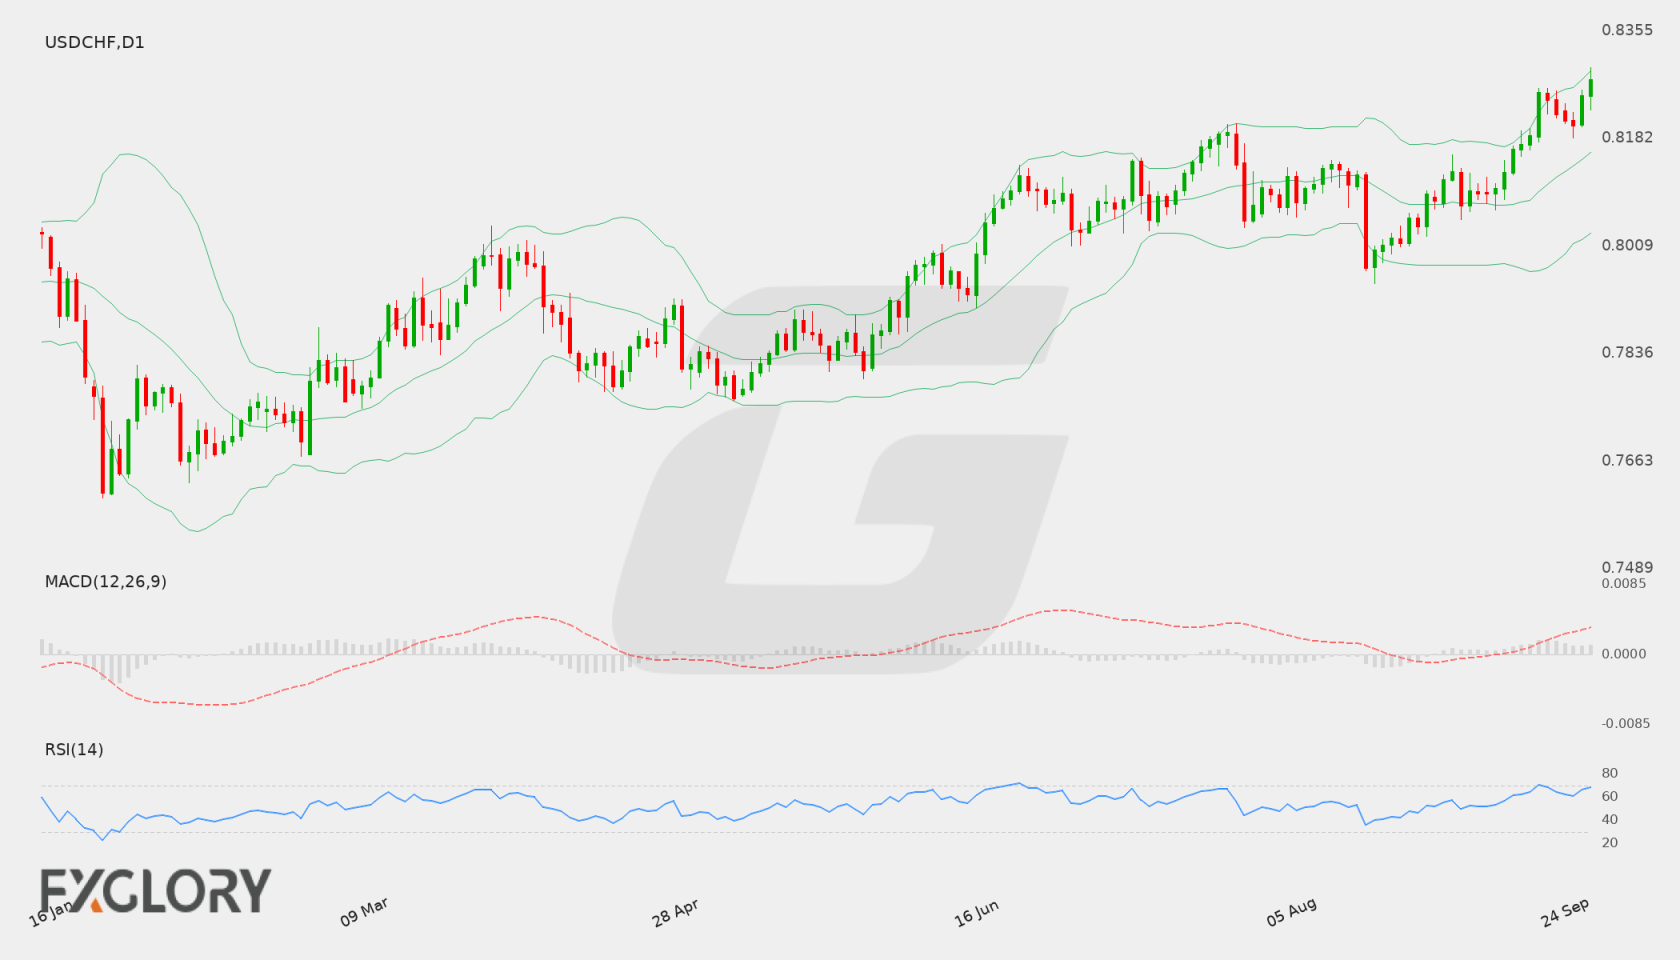
On the daily (D1) timeframe, USD/CHF has advanced significantly from recent lows around 0.82027 to close at 0.82764. The recent series of higher daily closes indicates robust buying interest as price approaches the key ceiling at 0.8295.
Key Technical Indicators:
Bollinger Bands: The D1 Bollinger Bands indicate a middle line at 0.81592, an upper band at 0.82898, and a lower band at 0.80285. Trading near 0.82764 puts the price close to the upper boundary, signaling strong upward momentum and elevated volatility.
RSI: The 14-day Relative Strength Index (RSI) is currently reading 68.46, pointing to strong buying momentum while approaching the overbought threshold of 70.
MACD: The MACD histogram and signal line stand in positive territory at 0.00440, confirming ongoing bullish momentum for USD/CHF on the daily chart.
Support and Resistance:
Immediate technical resistance for USD/CHF is located at 0.8295. Major technical support on the daily chart is positioned at 0.79483.
News to Watch for USDCHF This Week:
ISM Manufacturing PMI: This indicator measures business activity in the US manufacturing sector and may impact USD demand.
ISM Manufacturing Prices: This event tracks price inflation within manufacturing and provides clues on economic cost pressures.
Weekly Outlook and Consideration:
USD/CHF enters the week with a strong bullish bias, supported by an RSI of 68.46 and a positive MACD reading of 0.00440. Price action near 0.82764 is pressing against the upper Bollinger band at 0.82898 and testing horizontal resistance at 0.8295. A sustained breakout above 0.8295 could see further bullish continuation, whereas a rejection at this level might trigger a consolidation back toward the middle Bollinger band near 0.81592. Market direction will also depend on upcoming US manufacturing data releases.
Disclaimer: The analysis provided for USD/CHF is for informational purposes only and does not constitute investment advice. Traders are encouraged to perform their own analysis and research before making any trading decisions. Market conditions can change quickly, so staying informed with the latest data is essential.
The USD/CHF currency pair shows heightened sensitivity to upcoming economic releases from the United States. Key macroeconomic data regarding economic expansion, labor conditions, and price pressures could heavily influence sentiment and drive pair volatility over the coming sessions. Market participants will monitor these releases closely to assess broad monetary policy expectations and risk appetite.
Price Action:
On the Daily (D1) chart, USD/CHF has displayed notable upward momentum, pushing higher from recent swing areas toward key overhead resistance. The pair recently recorded strong bullish daily sessions, reaching a high of 0.82625 before closing near 0.82437. While price action highlights firm buying pressure, its current proximity to major resistance suggests potential consolidation or technical resistance in the near term.
Key Technical Indicators:
Bollinger Bands: The daily Bollinger Bands reveal USD/CHF trading right near the upper band at 0.82427, with the middle band situated at 0.81080 and the lower band at 0.79734. Price pressing against the upper band underscores strong recent buying interest, although sustained trading near band extremes frequently increases the likelihood of temporary consolidation or a pullback toward the mid-band area.
RSI: The 14-day Relative Strength Index (RSI) stands at 68.35. This reading reflects strong bullish momentum while approaching the traditional overbought threshold of 70, suggesting that while the trend favors buyers, the pair could experience diminishing upside speed or a minor corrective pause.
MACD: The D1 MACD indicator remains in positive territory with a main value around 0.00353. The positive position above the zero line supports ongoing upward momentum, indicating that buyers currently hold technical control, though traders should monitor for any momentum shifts near major overhead barriers.
Support and Resistance:
USD/CHF is testing key resistance at 0.82625, a critical level that could determine the pair’s next directional move. On the downside, major technical support is established at 0.79483, with dynamic intermediate support provided by the daily middle Bollinger Band around 0.81080.
News to Watch for USDCHF This Week:
CB Consumer Confidence: Assesses consumer optimism which can influence broad spending trends and economic trajectory.
JOLTS Job Openings: Measures employment demand and labor force turnover dynamics.
ADP Non-Farm Employment Change: Offers an early indication of private sector hiring activity.
Core PCE Price Index m/m: Serves as a vital measure of underlying consumer price inflation.
Final GDP q/q: Reflects the overall pace of national economic performance and growth.
ISM Manufacturing PMI: Provides an evaluation of business conditions and health within the manufacturing sector.
Average Hourly Earnings m/m: Tracks wage growth trends affecting consumer purchasing power and inflation pressures.
Non-Farm Employment Change: Highlights overall job creation across non-agricultural sectors.
Unemployment Rate: Shows the proportion of the workforce actively seeking employment.
Weekly Outlook and Consideration:
The weekly outlook for USD/CHF points to a dominant bullish structure on the daily timeframe, supported by positive MACD signals and price position near the upper Bollinger Band. However, with RSI nearing 70 and price directly confronting key resistance at 0.82625, a pause or minor pullback toward 0.81080 remains possible before further directional clarity emerges. A successful break above resistance could reinforce upside momentum, while failure to clear it may lead to horizontal range movement.
Disclaimer: The analysis provided for USD/CHF is for informational purposes only and does not constitute investment advice. Traders are encouraged to perform their own analysis and research before making any trading decisions. Market conditions can change quickly, so staying informed with the latest data is essential.