FXGlory – the first and only broker in the world with the leverage of 1:3000! Manage a large amount of money with a much smaller deposit. Set the leverage of 1:3000 and create new opportunities of trading on the Forex market.
Investors are often eager to discover investment prospects that offer the potential for profitability. The Forex market presents an accessible avenue for interested investors, including individuals like yourself. FXGlory facilitates a straightforward learning process for trading, enabling you to potentially earn returns. Our aim is to assist you in navigating the Forex market in a user-friendly and accessible manner.
Leverage up to 1:3000
Amplify Your Potentials With Higher Leverages for Bigger Opportunities.
50% Deposit Bonus
Boost Your Trading Power. Enjoy a 50% Deposit Bonus on Your Investments.
5% Deposit Discount
Enjoy a discount of 5%, on your crypto deposits.
Free Remote VPS
Seamless Trading Anytime,
Anywhere with our free VPS Plans
Fixed and low spreads
Steady and Predictable Costs,
with your trusted forex broker!
Swap-free accounts
Explore our Swap-Free Accounts
for Interest-Free Trades.
ECN Trading Accounts
Direct market access with tight spreads and fast execution.
24/7 Support
Access our 24/7 Support
for Seamless Trading Guidance.
You will have
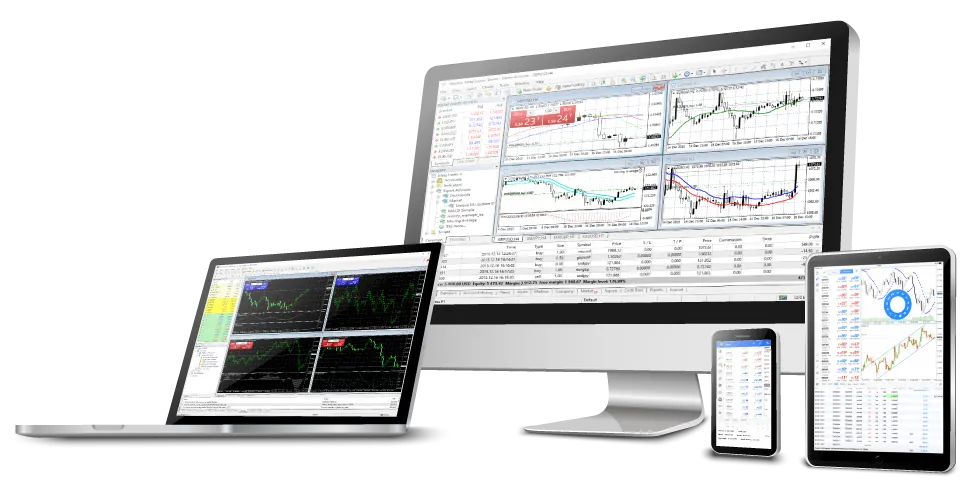
Multi Forex Platforms
The MetaTrader 4 and MetaTrader5 terminals, along with WebTrader, are perfectly equipped traders’ workplaces that facilitate trading in the financial markets (Forex and Futures). They are professional Forex trading software options, preferred by both beginners and experienced traders alike. These platforms provide access to advanced charts for making informed decisions and gaining an edge in the Forex market. They furnish the necessary tools and resources for analyzing price dynamics of financial instruments, executing trade transactions, and developing/utilizing automated trading programs (Expert Advisors). Representing the all-in-one concept, they stand as the world’s most popular trading terminals.