Time Zone: GMT +2
Time Frame: 4 Hours (H4)
Fundamental Analysis:
The EURUSD H4 technical and fundamental analysis reflects a relatively balanced macroeconomic backdrop, with both the Euro and US Dollar influenced by medium-impact data. On the Euro side, the upcoming Eurostat consumer confidence release serves as a leading indicator of economic sentiment and consumer spending, which is crucial for overall Eurozone growth. A stronger-than-forecast reading could support the EUR by signaling improved optimism among consumers. Meanwhile, the USD is facing delayed construction spending data due to the US government shutdown, which may reduce immediate volatility but create uncertainty regarding future economic projections. Overall, the fundamental outlook for EURUSD suggests moderate volatility, with traders focusing on sentiment-driven data and forward guidance, making this EURUSD daily analysis highly sensitive to macroeconomic expectations.
Price Action:
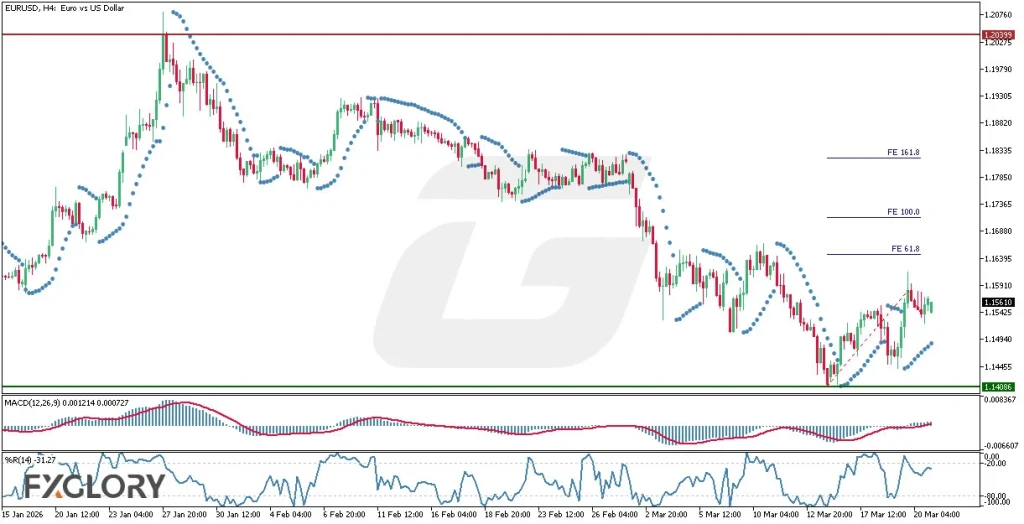
The EURUSD H4 price action analysis shows a prolonged consolidation phase within a broad range. It has been a long while since the candles have been moving between the support line 1.14086 and the resistance level 1.20399. Currently, after having hit the support line again, the candles have reacted and moved up, indicating strong buyer interest at lower levels. The recent bullish recovery suggests a potential short-term reversal within the range structure. Based on the Fibonacci expansion levels, we could expect the candles to reach level 61.8 before forming any other corrections, reinforcing a corrective bullish move in this EURUSD H4 chart forecast.
Key Technical Indicators:
Parabolic SAR: The Parabolic SAR dots are currently below the candles, indicating a bullish trend shift in the EURUSD H4 analysis. This suggests buyers are gaining control and supporting the ongoing upward price action.
MACD (12,26,9): The MACD values (0.001214, 0.000727) show the MACD line above the signal line, reflecting bullish momentum. The positive histogram indicates increasing buying pressure in this EURUSD price action.
Williams %R (14): The Williams %R stands at -31.27, signaling neutral conditions with no overbought pressure yet. This suggests there is still room for further upward movement in the EURUSD H4 chart.
Support and Resistance:
Support: The key support level is located at 1.14086, which has recently held strong and triggered a bullish reaction.
Resistance: The major resistance level stands at 1.20399, marking the upper boundary of the long-term range.
Conclusion and Consideration:
The EURUSD H4 technical and fundamental analysis highlights a market currently rebounding from strong support within a broader consolidation range. The combination of bullish signals from the Parabolic SAR, positive MACD momentum, and neutral Williams %R suggests a potential continuation toward the Fibonacci 61.8 level in the short term. However, the overall range-bound structure remains intact, requiring caution for breakout confirmation. From a fundamental perspective, upcoming Eurozone sentiment data and delayed US economic releases may influence volatility and direction. Traders should closely monitor both technical confirmation and macroeconomic developments when evaluating EURUSD price action strategies.
Disclaimer: The analysis provided for EUR/USD is for informational purposes only and does not constitute investment advice. Traders are encouraged to perform their own analysis and research before making any trading decisions on EURUSD. Market conditions can change quickly, so staying informed with the latest data is essential.