Time Zone: GMT +2
Time Frame: 4 Hours (H4)
Fundamental Analysis:
The GOLD-USD pair continues to benefit from strong safe-haven demand amid escalating US–Israel vs Iran geopolitical tensions, reinforcing the bullish outlook on the H4 chart. Ongoing geopolitical uncertainty is driving investors toward gold as a hedge against risk and inflation concerns. Meanwhile, today’s USD news—including speeches from FOMC members John Williams and Neel Kashkari—could increase volatility in the US Dollar. A hawkish tone may temporarily pressure XAU-USD, while dovish signals could support further upside toward the ATH zone.
Price Action:
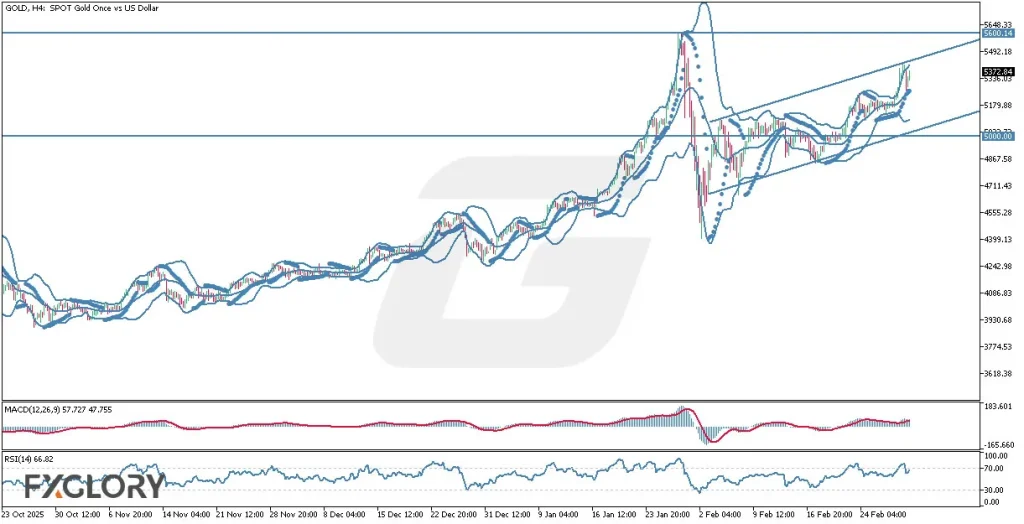
On the H4 timeframe, GOLDUSD technical analysis shows price advancing within a well-defined bullish ascending channel after reclaiming the 5300 psychological level. The structure of higher highs and higher lows confirms trend continuation as price approaches the 5400–5600 resistance area near the previous All-Time High. Price remains positioned in the upper half of the Bollinger Bands, highlighting sustained bullish momentum in this H4 gold price action analysis.
Key Technical Indicators:
Bollinger Bands: Price is trading in the upper half of the Bollinger Bands, confirming strong bullish pressure. The middle band near 5300 acts as dynamic support, while the lower band around 5100 marks deeper correction potential.
Parabolic SAR: The Parabolic SAR dots remain below the candles, signaling that the bullish trend is intact. This configuration supports continued upside as long as no bearish flip occurs.
MACD (12,26,9): The MACD (57.727 vs 47.755) remains above the signal line, indicating sustained positive momentum. The bullish setup supports continuation toward higher resistance levels.
RSI (14): The RSI stands at 66.82, approaching overbought territory but still below 70. This reflects strong buying momentum with limited signs of immediate exhaustion.
Support and Resistance:
Support: Immediate support is located at 5300, aligning with the middle Bollinger Band and recent breakout structure within the ascending channel. Stronger support is found near 5100, corresponding with the lower Bollinger Band, while the 5000 psychological level remains a key structural base.
Resistance: Initial resistance is observed at 5400, which coincides with recent swing highs inside the bullish channel. Major resistance stands at 5500 and extends toward 5600, representing the previous All-Time High zone and a critical breakout area.
Conclusion and Consideration:
The GOLD / XAUUSD / GOLDUSD H4 technical and fundamental chart daily analysis indicates sustained bullish momentum supported by strong price structure and confirming indicators. However, upcoming USD-related speeches and macroeconomic releases may trigger volatility and short-term pullbacks. Traders should closely monitor price behavior near the 5400–5600 resistance zone while maintaining disciplined risk management in this H4 gold trading strategy.
Disclaimer: The analysis provided for GOLD/USD is for informational purposes only and does not constitute investment advice. Traders are encouraged to perform their own analysis and research before making any trading decisions on GOLDUSD. Market conditions can change quickly, so staying informed with the latest data is essential.