Time Zone: GMT +2
Time Frame: 4 Hours (H4)
Fundamental Analysis:
The GBPUSD H4 technical and fundamental analysis today is driven by key macroeconomic releases from both the UK and the US. For the USD, traders are monitoring the S&P Global Manufacturing PMI, ISM Manufacturing PMI, and the ISM Manufacturing Prices Paid index. Stronger-than-forecast PMI readings above 50.0 would indicate expansion and could support the US Dollar, increasing volatility in the GBPUSD H4 chart. On the GBP side, Nationwide House Price Index (HPI), BOE money supply data, mortgage approvals, consumer credit figures, and speeches from BOE MPC members are in focus. Hawkish commentary or stronger UK data may provide short-term support to the British Pound and influence the GBPUSD H4 price action.
Price Action:
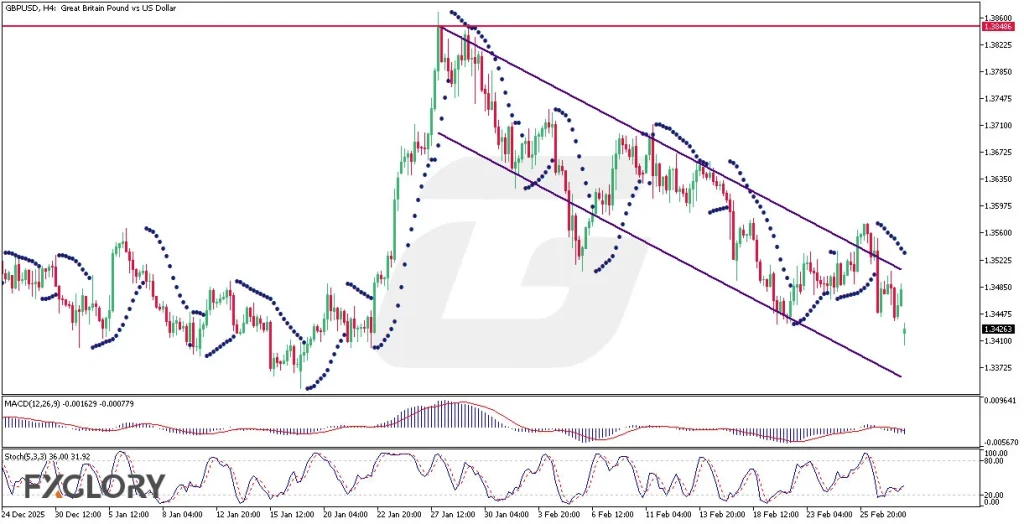
In this GBPUSD H4 chart daily analysis, after marking the highest level in a while at 1.38486, the candles have begun descending along a clear bearish channel, forming several breakout failures along their way. The rejection near the upper boundary confirmed strong selling pressure and a shift to a bearish market structure. Currently, the candles have reached the mid-band of the channel, acting as a decision zone. If bearish momentum continues, the price could move toward the lower band of the channel, reinforcing the ongoing downtrend in this GBPUSD H4 technical analysis.
Key Technical Indicators:
Parabolic SAR: The Parabolic SAR dots remain above the candles, confirming a bearish trend on the H4 timeframe. As long as the dots stay above price, selling pressure dominates and the downward channel structure remains valid.
MACD (12,26,9): The MACD is in negative territory with the MACD line below the signal line, reflecting ongoing bearish momentum. No bullish crossover is visible yet, keeping the GBPUSD H4 forecast tilted to the downside.
Stochastic (5,3,3): The Stochastic is below the 50 level, indicating weak bullish momentum and room for further downside. A turn back toward oversold would support continuation of the bearish price action.
Support and Resistance:
Support: Immediate support is located at 1.34260, aligning with a recent swing low and the lower half of the bearish channel.
Resistance: The nearest resistance level stands at 1.35600, near the mid-to-upper boundary of the descending channel.
Conclusion and Consideration:
The GBPUSD H4 technical and fundamental analysis shows that the pair remains under bearish pressure within a descending channel after failing to hold above 1.38486. Technical indicators support a cautious bearish outlook, while upcoming PMI data and BOE-related events may trigger volatility. Traders following this GBPUSD H4 chart daily analysis and price action strategy should wait for confirmation signals around key support and resistance levels.
Disclaimer: The analysis provided for GBP/USD is for informational purposes only and does not constitute investment advice. Traders are encouraged to perform their own analysis and research before making any trading decisions on GBPUSD. Market conditions can change quickly, so staying informed with the latest data is essential.