Time Zone: GMT +2
Time Frame: 4 Hours (H4)
Fundamental Analysis:
The Silver price dynamics (XAG/USD) could experience significant volatility amid today’s upcoming economic news from the United States, including the Treasury International Capital (TIC) data release, initial jobless claims, and speeches by Federal Reserve FOMC members. Hawkish comments from Fed officials, strong economic indicators, or better-than-forecast TIC data could strengthen the USD, adding bearish pressure on Silver. Conversely, any signs of economic slowdown, higher-than-expected unemployment claims, or dovish Fed statements could weaken the USD, providing fundamental support for a bullish turnaround in Silver.
Price Action:
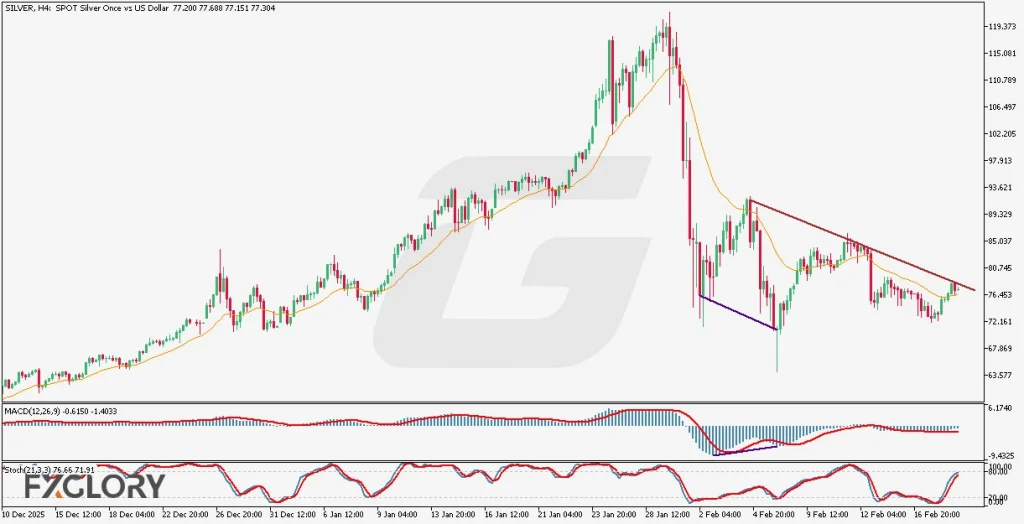
The H4 chart of Silver displays recent bearish activity followed by increasingly weaker bearish moves, consistently nearing the descending trendline. The inverted head and shoulders pattern formation and positive regular divergence between MACD and price suggest a potential bullish reversal. Price action is currently testing resistance provided by the trendline, indicating possible imminent bullish momentum.
Key Technical Indicators:
Moving Average (21): The 21-period moving average is currently positioned below the candlesticks, suggesting that the short-term momentum has turned bullish. A sustained move above this moving average line would reinforce bullish sentiment for XAG/USD.
MACD (12,26,9): The MACD indicator is positioned at -0.6150, below the zero line, but displaying a positive regular divergence, signaling weakening bearish momentum. A bullish crossover of the MACD line above the signal line would indicate a strong buying signal and potential bullish trend initiation.
Stochastic (21,3,3): The stochastic indicator at 76.66 (main line) and 71.91 (signal line) indicates the price is approaching overbought conditions. While this suggests caution, the indicator still has room to support upward movement in the near term, reinforcing bullish potential for the Silver price.
Support and Resistance:
Support: Immediate support is located around 72.161, corresponding to recent lows and the neckline of the inverted head and shoulders pattern.
Resistance: Nearest resistance is identified at approximately 80.735, aligning with the descending trendline and recent price reaction zones.
Conclusion and Consideration:
The XAG/USD H4 chart analysis suggests increasing bullish potential, supported by price action patterns and technical indicators. Traders should closely monitor today’s USD economic releases and Fed speeches, as these events could significantly influence market sentiment and price volatility. It’s prudent to await confirmation of a bullish breakout above resistance for a safer entry point.
Disclaimer: The analysis provided for XAG/USD is for informational purposes only and does not constitute investment advice. Traders are encouraged to perform their own analysis and research before making any trading decisions on XAGUSD. Market conditions can change quickly, so staying informed with the latest data is essential.