Time Zone: GMT +2
Time Frame: 4 Hours (H4)
Fundamental Analysis:
Today’s GBPUSD fundamental analysis reveals significant upcoming economic data for both the British Pound (GBP) and the US Dollar (USD). For GBP, inflation data, including the Consumer Price Index (CPI), Producer Price Index (PPI), Retail Price Index (RPI), and House Price Index (HPI), are closely watched. Positive inflation data could support GBP as traders anticipate potential interest rate hikes by the Bank of England (BoE). Meanwhile, USD traders will focus on Durable Goods Orders, Building Permits, Housing Starts, and Industrial Production, which are critical indicators of economic health and inflationary pressures, potentially impacting Federal Reserve monetary policy.
Price Action:
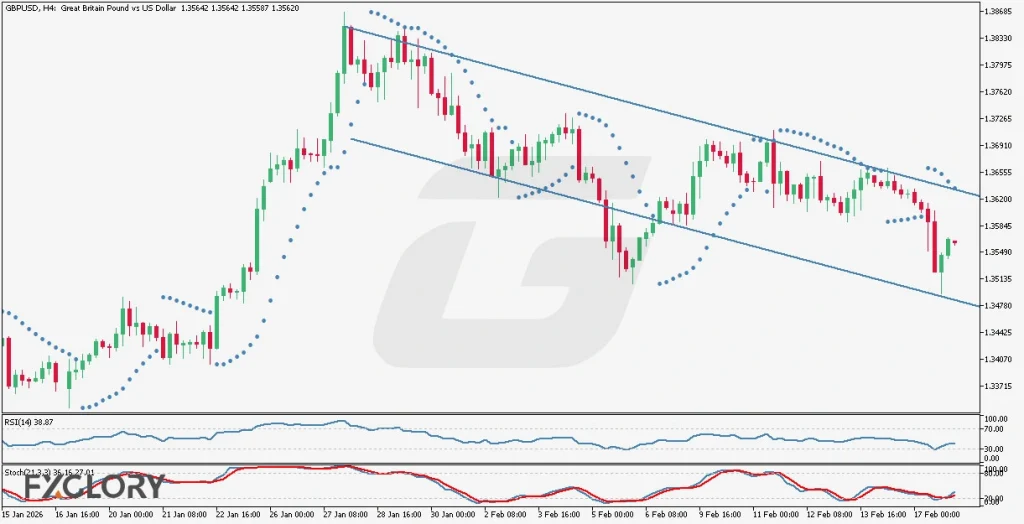
Analyzing GBPUSD price action on the H4 timeframe, the price has been falling steadily within a bearish channel, experiencing one breakout failure, after which it returned to the channel. Currently, candles are correcting upward towards the mid-band, suggesting a temporary retracement within the bearish trend. The ongoing bearish price action indicates continued control by sellers, suggesting potential downward continuation toward the lower boundary of the channel.
Key Technical Indicators:
Parabolic SAR: The Parabolic SAR dots are positioned above the candles, clearly indicating ongoing bearish momentum. This reinforces the current bearish bias and suggests the potential continuation of downward movement in GBPUSD.
RSI (14): The Relative Strength Index stands at 38.87, reflecting that the market is not yet oversold. This condition suggests further bearish potential, as there remains ample space before reaching oversold territory at the 30 level.
Stochastic (21,3,3): The Stochastic oscillator values are 36.16 and 27.01, signaling bearish momentum that has not yet reached oversold conditions. This implies that bearish pressure is ongoing, with room for further downward movement in price.
Support and Resistance:
Support: Immediate support for GBPUSD is identified at approximately 1.3480, aligning with recent lows and the lower boundary of the bearish channel.
Resistance: The primary resistance level is at around 1.3620, corresponding to the mid-band of the bearish channel and recent price consolidation.
Conclusion and Consideration:
In conclusion, the GBPUSD technical and fundamental analysis for the H4 timeframe clearly indicates a sustained bearish bias. Sellers currently dominate the market, reinforced by bearish price action and key indicators such as Parabolic SAR, RSI, and Stochastic oscillator. Traders should closely monitor the upcoming GBP inflation data and US economic releases, as positive or negative surprises could significantly impact market sentiment. Current technical conditions favor further downside, targeting the channel’s lower band.
Disclaimer: The analysis provided for GBP/USD is for informational purposes only and does not constitute investment advice. Traders are encouraged to perform their own analysis and research before making any trading decisions on GBPUSD. Market conditions can change quickly, so staying informed with the latest data is essential.