Time Zone: GMT +2
Time Frame: 4 Hours (H4)
Fundamental Analysis:
Today’s market sentiment for USDCAD is influenced significantly by the public holidays in both the US and Canada. The US observes Presidents’ Day, resulting in bank closures, typically leading to reduced liquidity and unpredictable volatility. Simultaneously, some Canadian banks will observe Family Day, although most provinces’ banks remain open, potentially resulting in mixed liquidity conditions. Traders should also monitor the upcoming speech by Federal Reserve Governor Michelle Bowman, whose remarks at the American Bankers Association Conference may provide insight into future US monetary policy, potentially impacting the USD.
Price Action:
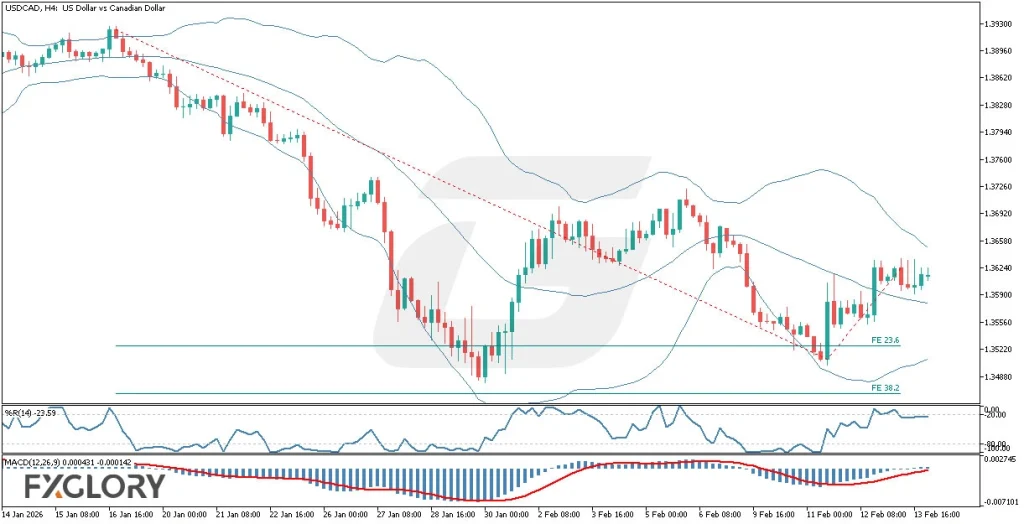
The USDCAD pair on the H4 timeframe has recently exhibited significant bearish sentiment, characterized by accelerated downward momentum. The current market price shows signs of consolidation, with recent lows being higher than previous lows, signaling potential range-bound movement. With the narrowing of Bollinger Bands, traders should anticipate an imminent expansion and potential breakout in either direction, with the Fibonacci expansion level at 23.6% as a key bearish target.
Key Technical Indicators:
Bollinger Bands (30): The Bollinger Bands have narrowed significantly, indicating low volatility and suggesting an upcoming breakout. Given recent bearish trends, traders should be prepared for possible downward expansion, although a bullish reversal cannot be ruled out.
William’s %R (14): Currently at -23.59, this indicator suggests the market is approaching an overbought condition. Traders should interpret this cautiously, as it implies potential exhaustion in the short-term bullish retracement within the overall bearish context.
MACD (12,26,9): The MACD histogram, slightly positive at 0.000431, indicates minimal bullish momentum. With the signal line close at -0.000142, traders must watch closely for a potential bearish crossover, which would confirm a continuation of the bearish trend.
Support and Resistance:
Support: Immediate support is identified near the Fibonacci expansion level at 1.3530, marking a critical zone where price consolidation recently occurred.
Resistance: The key resistance area is observed around the level of 1.3640, coinciding with recent highs and the upper Bollinger Band, representing a significant barrier to bullish movement.
Conclusion and Consideration:
The USDCAD H4 chart analysis reveals persistent bearish sentiment, supported by narrowing Bollinger Bands signaling imminent volatility. Technical indicators like William’s %R and MACD suggest traders should remain cautious, prepared for potential bearish momentum resumption. Given today’s public holidays in the US and Canada, traders should anticipate lower liquidity and irregular market conditions. Upcoming statements from Federal Reserve Governor Bowman may influence USD volatility and should be monitored closely.
Disclaimer: The analysis provided for USD/CAD is for informational purposes only and does not constitute investment advice. Traders are encouraged to perform their own analysis and research before making any trading decisions on USDCAD. Market conditions can change quickly, so staying informed with the latest data is essential.