Time Zone: GMT +2
Time Frame: 4 Hours (H4)
Fundamental Analysis:
The USDJPY H4 forex chart analysis is influenced today by a series of key U.S. economic events and central bank communications. Federal Reserve members including Raphael Bostic, Stephen Miran, Beth Hammack, and Lorie Logan are scheduled to speak about economic and monetary policy. Traders will be monitoring their tone for hawkish or dovish signals, which could impact USD strength. On the data front, figures such as Retail Sales, Import Prices, and Employment indicators are lined up, although delayed due to the government shutdown. For Japan, the Bank of Japan’s monetary base report and machine tool orders may influence JPY volatility. Overall, this creates a backdrop of potential USDJPY volatility, making today’s H4 chart highly relevant for traders.
Price Action:
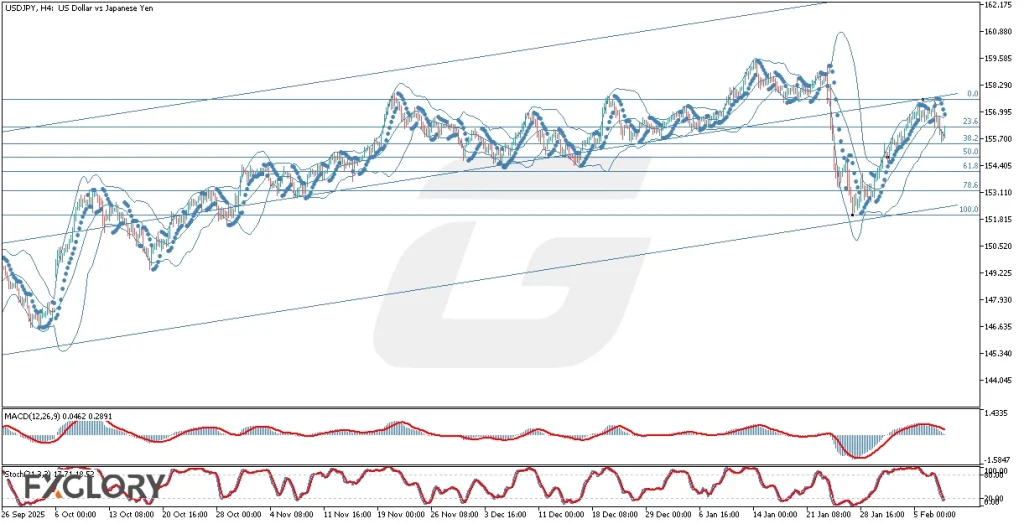
The USDJPY pair is trading within a clearly defined ascending regression channel on the H4 timeframe. The price is currently located in the lower half of the channel, just below the midline, which aligns closely with the 0% Fibonacci retracement level. After a strong corrective dip, the pair has bounced back, but now shows signs of consolidation between the 38.2% and 23.6% Fibonacci levels. The most recent candlestick is green, suggesting a potential intraday rebound; however, the upward strength is uncertain due to proximity to resistance and technical indicator signals.
Key Technical Indicators:
Bollinger Bands: The price is currently in the lower half of the Bollinger Bands and has recently touched the lower band, indicating temporary bearish pressure. However, the latest green candle suggests a short-term attempt at recovery. The price remains below the middle band, which coincides with the 0% Fibonacci level, adding weight as dynamic resistance.
MACD (12,26,9): The MACD line is at 0.462 and the signal line at 0.2891, both in positive territory. However, the histogram is weakening, hinting at declining bullish momentum. This could be an early signal of either consolidation or potential reversal in the short term.
Stochastic Oscillator (21,3,3): The Stochastic Oscillator reads 17.71 and 18.52, indicating that the pair is currently in oversold territory. This implies that bearish momentum might be exhausted, and a bullish correction could be imminent, particularly if confirmed by upcoming candles or fundamentals.
Parabolic SAR: The Parabolic SAR dots are currently positioned above the price candles, confirming short-term bearish sentiment. A shift of dots below the candles would be a potential early buy signal, but for now, caution is warranted.
Support and Resistance:
Support: Strong support is located near the 154.40 zone, which corresponds with the 50.0% Fibonacci level and previous reaction lows. A break below this level could invite further downside toward 153.10.
Resistance: Immediate resistance lies around the 156.40–156.60 area, aligning with the 23.6% Fibonacci level and the lower edge of the previous consolidation range. A breakout above this zone could open the path toward 158.00.
Conclusion and Consideration:
The USDJPY H4 chart reflects a technically corrective phase within a broader bullish channel. While the price remains under pressure in the short term, oversold Stochastic, positive MACD, and the latest green candle suggest a possible rebound. The ongoing speeches from several FOMC members, along with multiple U.S. economic indicators, introduce fundamental volatility, which could cause sharp intraday moves. Traders are advised to monitor key support at 154.40 and resistance at 156.60 for breakout opportunities. Use proper risk management, especially with today’s heavy USD and JPY news flow, which could disrupt technical setups.
Disclaimer: The analysis provided for USD/JPY is for informational purposes only and does not constitute investment advice. Traders are encouraged to perform their own analysis and research before making any trading decisions on USDJPY. Market conditions can change quickly, so staying informed with the latest data is essential.