Time Zone: GMT +2
Time Frame: 4 Hours (H4)
Fundamental Analysis:
The USD-CAD currency pair is influenced today by several key economic events from both the United States and Canada. From the US side, speeches from President Donald Trump and Federal Reserve Governor Philip Jefferson may introduce notable volatility, especially if comments touch on inflation or monetary policy. Additionally, the University of Michigan is releasing its Consumer Sentiment and Inflation Expectations reports, both of which are leading indicators of consumer behavior and potential interest rate adjustments. Meanwhile, Canadian data today focuses on Employment Change, Unemployment Rate, and Ivey PMI—all critical to assessing the country’s economic health. These high-impact releases could significantly influence the daily chart outlook and H4 price action for USD CAD in the short term.
Price Action:
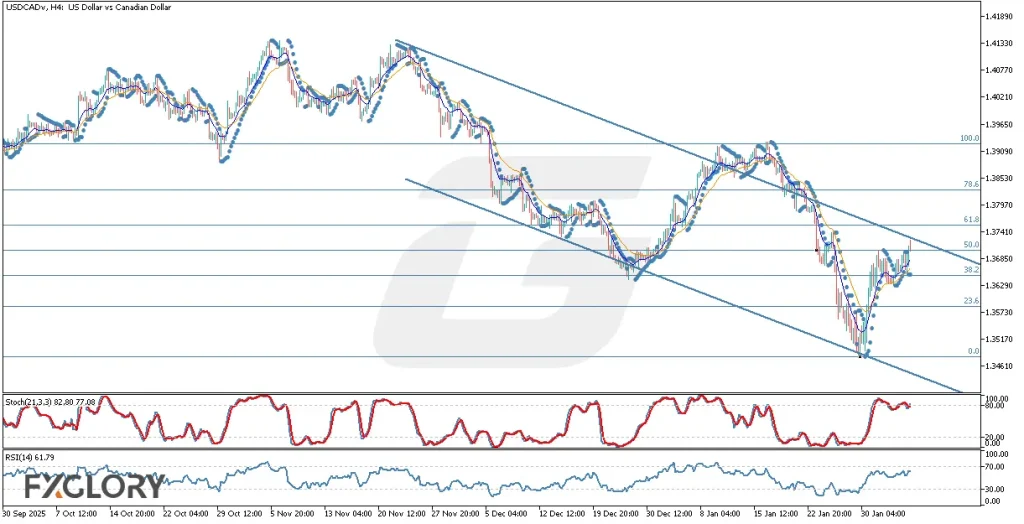
The USDCAD price action on the H4 chart has shown a corrective upward movement within a longer-term bearish trend channel. The price is currently approaching the upper boundary of the descending channel and is testing the 50.0 Fibonacci retracement level after a strong rebound from the 0.0 level near 1.3460. The recent candles demonstrate strong bullish momentum with higher highs and higher lows. A breakout above the trendline resistance could signal a shift in medium-term sentiment, but rejection at this level could maintain the pair’s bearish structure.
Key Technical Indicators:
Moving Averages (MA 9 and MA 21): The short-term moving average (MA 9 – blue) has crossed above the longer-term MA 21 (orange), both sloping upwards, indicating increasing bullish pressure. This crossover supports the ongoing bullish correction, with momentum attempting to push the price above the 50.0 Fibonacci level and potentially toward the 61.8 zone.
Parabolic SAR: Parabolic SAR dots have shifted below the candles, confirming the current upward bias. This placement typically signals buy-side control and aligns with the rising momentum in this H4 technical chart analysis of USD/CAD.
Stochastic Oscillator (21,3,3): The Stochastic Oscillator is currently at 82.80 and 77.08, signaling that the pair is entering overbought territory. While this suggests strong momentum, it also warns of a possible short-term pullback or consolidation near the resistance area.
Relative Strength Index (RSI 14): The RSI stands at 61.79, below the overbought level of 70, showing bullish strength without being overextended. This implies there’s still room for additional gains, provided the pair can break above key resistance.
Support and Resistance:
Support: Immediate support lies around the 1.3620–1.3650 area, near the 38.2 Fibonacci level and recent consolidation zone.
Resistance: Key resistance is found near 1.3740, aligning with the 50.0 Fibonacci retracement and the descending channel’s upper boundary.
Conclusion and Consideration:
In this USD-CAD H4 daily technical and fundamental chart analysis, the pair is currently in a bullish correction within a broader bearish trend. All technical indicators support upward momentum, though the Stochastic Oscillator suggests caution as the market approaches resistance. Today’s impactful US and Canadian economic news, especially employment data and central bank commentary, may dictate the next directional move. A confirmed break above the trend channel could shift the market’s medium-term bias to bullish, while rejection may see the pair resume its downtrend.
Disclaimer: The analysis provided for USD/CAD is for informational purposes only and does not constitute investment advice. Traders are encouraged to perform their own analysis and research before making any trading decisions on USDCAD. Market conditions can change quickly, so staying informed with the latest data is essential.