Time Zone: GMT +2
Time Frame: 4 Hours (H4)
Fundamental Analysis:
The EUR/USD pair is likely to experience fundamental-driven volatility today, as both currencies face impactful economic events. For the Euro, traders are closely watching the speech by Deutsche Bundesbank President Joachim Nagel in Berlin on the “Digital Euro,” which could influence expectations around future ECB monetary policy—any hawkish tones may strengthen the Euro. Additionally, the Eurozone’s Unemployment Rate, though lagging, will provide key insights into labor market health; a better-than-forecast result may lend short-term support to the Euro. Meanwhile, the USD side faces multiple high-frequency indicators including the ADP NER Pulse and housing data from the FHFA and S&P Corelogic Case-Shiller Index. These will reflect consumer spending and economic strength—positive surprises could counterbalance recent Euro strength, potentially limiting EUR/USD gains.
Price Action:
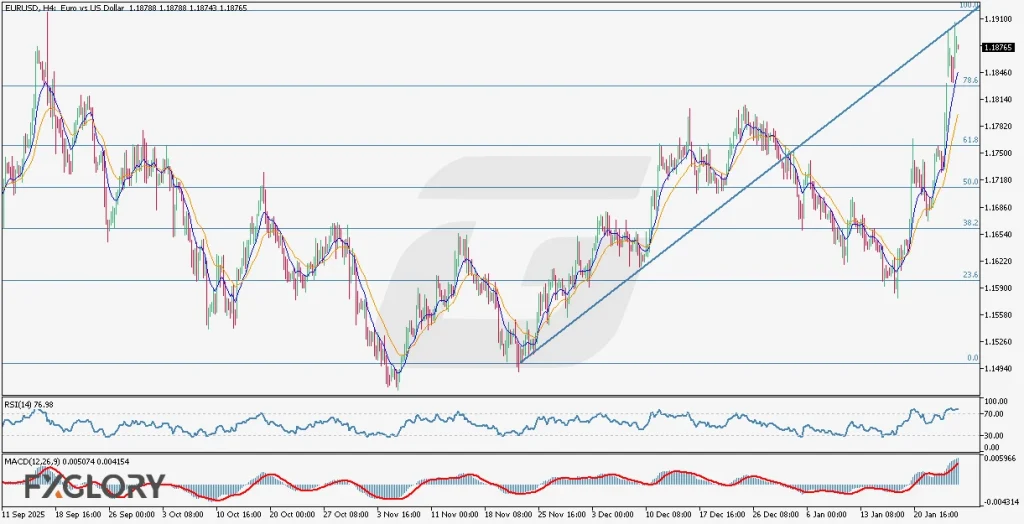
EURUSD has surged aggressively in the H4 timeframe, breaking above the significant 1.18500 psychological level for the first time in 2026 and briefly testing the 1.19000 mark. This move reflects a strong bullish breakout from a prior consolidation range. The price is currently hovering between 1.18700 and 1.18800, with multiple bullish candlesticks showing strong upward momentum. However, the pair has now touched a long-standing ascending trendline, which has historically acted as a resistance level—raising the possibility of short-term exhaustion or consolidation before any further rally toward 1.20000.
Key Technical Indicators:
Moving Averages (9 EMA & 21 EMA): The short-term 9-period EMA (blue) has crossed decisively above the longer-term 21-period EMA (orange), confirming a bullish crossover. Both EMAs are sharply upward sloping, reinforcing the current bullish momentum on the EUR to USD H4 chart. This crossover typically signals sustained price strength, although proximity to a resistance trendline suggests the potential for a pullback.
Relative Strength Index (RSI 14): The RSI is currently at 76.47, deep in the overbought territory. This suggests that the EUR-USD pair may be overextended in the short term. While this supports the current bullish trend, it also warns of a possible correction or consolidation as buyers may begin to take profits.
MACD (12,26,9): The MACD line is at 0.00564 and remains above the signal line at 0.00415, with the histogram expanding, indicating increasing bullish momentum. This supports continued upward pressure. However, given the steep rise, any flattening of the histogram could be an early sign of momentum weakening.
Support and Resistance:
Support: Immediate support lies near the 1.17900 level, aligned with the 78.6% Fibonacci retracement level and recent breakout zone. A drop below this could target 1.17000 at the 61.8% level.
Resistance: The next resistance level is at the 1.19000 psychological level, followed by 1.20000 at the 100.0 Fibonacci extension zone, which also aligns with bullish targets.
Conclusion and Consideration:
The EUR/USD pair on the H4 chart remains firmly bullish in both technical and fundamental context. The crossover of EMAs, elevated MACD, and RSI readings reflect strong upward momentum, while recent price action has shattered key resistance levels. However, traders should exercise caution as the RSI is overbought and price has reached a dynamic trendline resistance. Any unexpected hawkish signals from US economic data or dovish tones from the ECB’s Nagel speech could reverse the current bullish bias. Traders may consider waiting for either a break above 1.1900 for continuation or signs of rejection and divergence for a retracement.
Disclaimer: The analysis provided for EUR/USD is for informational purposes only and does not constitute investment advice. Traders are encouraged to perform their own analysis and research before making any trading decisions on EURUSD. Market conditions can change quickly, so staying informed with the latest data is essential.